

1. Raw Stadia’s data goals and objectives
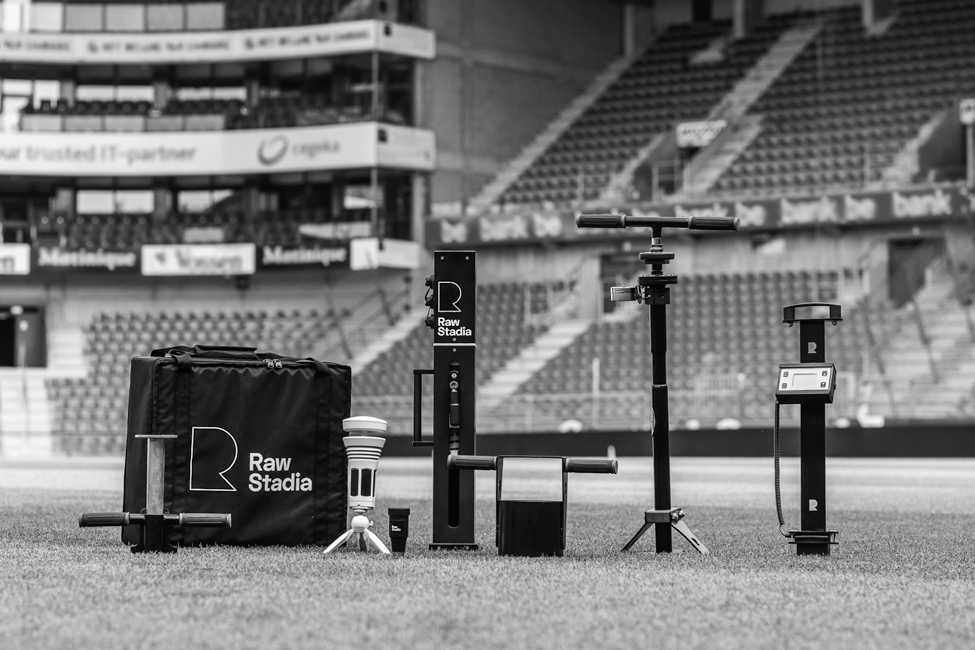
In elite sports, everything is measured, from blood analysis to analysis of player performance tracking with GNSS technology. However, the playing surface, a variable players interact with daily, is often left out of the equation.
Raw Stadia aims to shed light on this blind spot and strives for teams to have a holistic view and complete data set about their players.
Merely collecting the data as a service is insufficient. Raw Stadia wanted to empower their end users by providing them the right tools to harness valuable insights from their data to optimise and facilitate decision making processes about the pitch and the players.
The main goal of their data journey was to build interactive dashboards for end users, making it easier for them to create their own reports and communicate with key stakeholders within the club.
2. Raw Stadia’s Data Journey
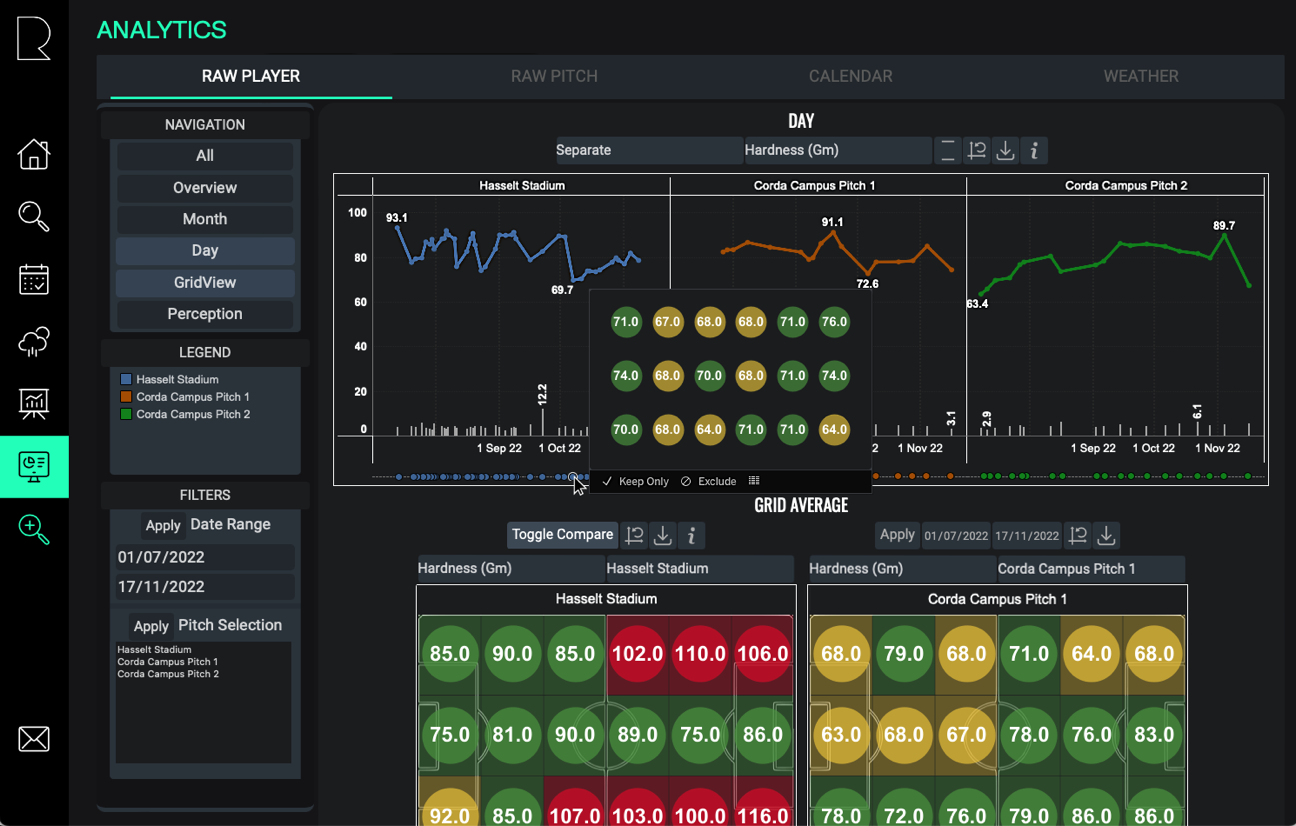
Raw Stadia’s platform aims to provide clients an easy way to perform some in-depth analysis within the application’s interface. Today, the team’s analysts can create views to:
- Compare multiple pitches overtime
- Compare different tests overtime
- Analyse aggregations of your collected data over any timeframe or collection of pitches, with controllable filters and parameters.
- Export data tables and images of your views
“It wasn’t always like that, however. In the first year of the company after go-to-market (2019), the first teams that adopted and integrated the Raw Stadia technology were three EPL teams: Liverpool FC, Crystal Palace FC and Leicester City FC. These clubs collected a manageable amount of data.” says Yannick Lambrichts, Head of Performance at Raw Stadia.
“We exported the separate tables from the database and rebuilt the database schema in traditional spreadsheets like Microsoft Excel. By aggregating the data we were not only able to show fluctuation of the surface over time but also highlight zones within the pitch that are different and in need of precision-management.”
But as the company and the investment of clubs into the technology grew alongside an exponential increase in data collection caused the current data analysis set-up to fail.
“Through the professional network of the company we got in touch with Biztory and had some great conversation on the ‘power of BI’. Easy to use, automate and report once the dashboards are set up… sounded like a dream at that point as we would be able to process the amount of data more efficiently.”
Together, we tackled most of the challenges on Raw Stadia’s data journey.
2.1 Data Challenges
One of the first hurdles we had to take was learning how to merge two datasets onto a single timeline. At the time, a union was needed whilst nowadays a relationship is established between tables in a very practical way.
The most challenging aspect of the project was the embedding of Tableau into their web-based platform. As Raw Stadia is a relatively small start-up, it is common not to have in-house developers but outsource this work to a development partner. This raised questions about the setup of their infrastructure, authentication, and row-level security.
Once these questions were answered, it was time to finish up an MVP of the embedded analytics staging page in the following weeks. During this period, iterative sessions were held to analyse and solve problems such as moving content between staging and production environments, making authentication work across different browsers and implementing the right row-level security.
Once Embedded Analytics was ready, they beta-tested with a few end users. From testing, Raw Stadia came across challenges such as running into memory issues and load time of the visualisations.
For every challenge on the data journey, there was a solution. And that’s where Biztory came in.
2.2 Data Solutions
The first phase was mainly focused on automation of the data sources.
“To step away from our Excel-dataset and create a means to extract the data straight from our database, we consulted Biztory to guide us in setting up a secure connection to the MySQL-server. Once setting up the data schema in the Tableau data source, extracting the data was no longer a resource intensive step and we could focus on providing the end users with monthly custom data reports.”
As the success of the company continued to grow and the amount of data reports kept increasing in amount, size and format, the envisioned approach of embedding Tableau into the Raw Stadia platform became more and more relevant. This resulted in setting up our 3-day Embedded Lab service in the summer of 2021 in which an initial proof of concept was attained in collaboration with Raw Stadia’s data analyst Peter Davids and their development partner.
Self-Service Analytics for Everyone
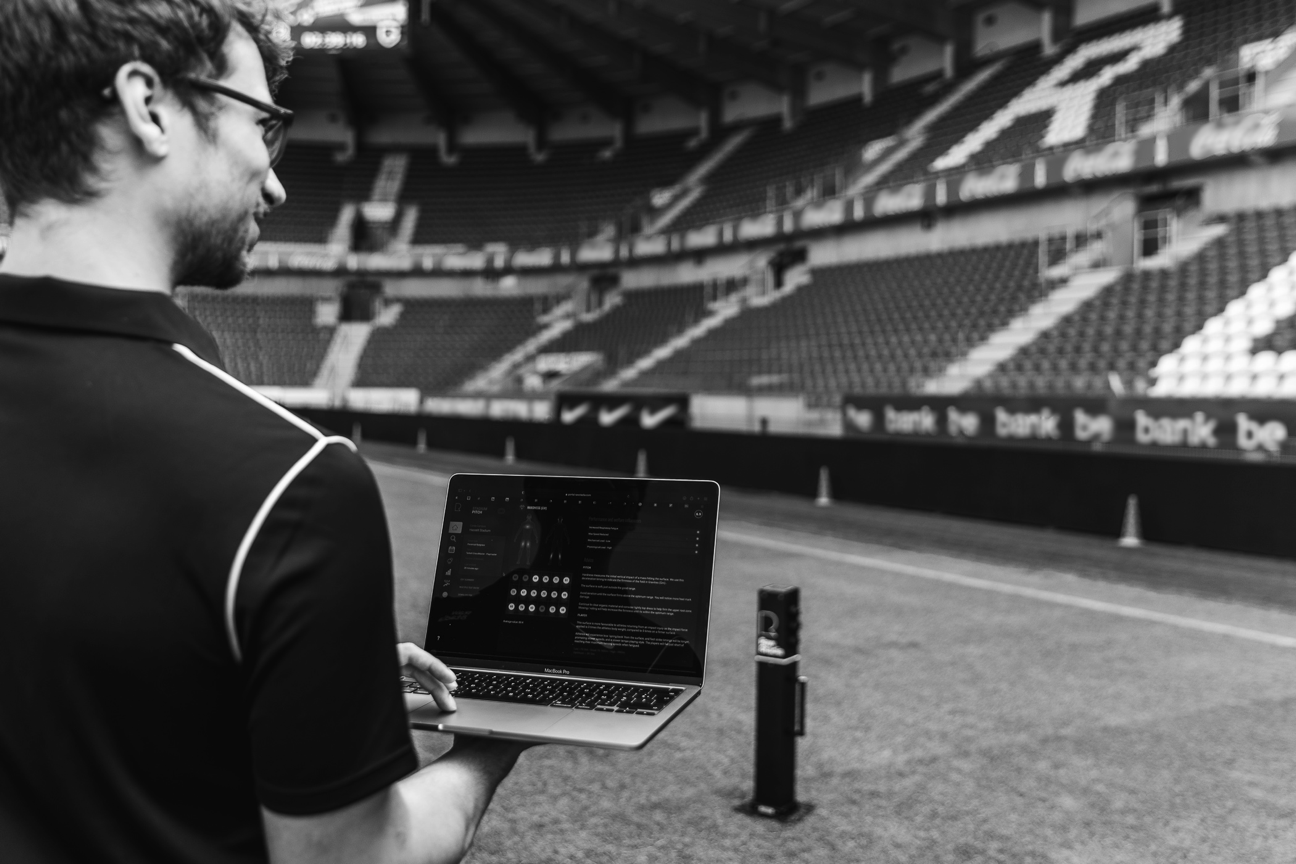
Raw Stadia uses Tableau not only to analyse surface data, but to investigate trends and research the effect of grounds management activities and weather on surface properties.
Using Tableau for thorough analysis of data that comes from validity and reliability research with the surface testing devices they’ve developed lets their consumers consume their data in ways that their previous front-end platform did not allow.
Monetizing data by cutting costs to increase ROI
And it doesn’t stop there! Besides bringing valuable insights at the fingertips of clients and end users, embedding analytics into their web-based platform also allows Raw Stadia to monetise their data.
“We can cut back on development costs by using embeds which enables us to test certain features. Some of which we are currently turning into an integral part of our platform. An exciting example of this is the development of Raw Player Indexes which takes into account all surface metrics to assess the expected effect of the pitch on players’ expected endurance, speed and agility before the session even started. This helps manage expectations, but foremost informs key stakeholders in time, enabling them to adapt their session or training location accordingly if need be.”
3. Next steps on the data journey
Embedded Analytics now contains the tested surface data and analysis of the player-surface interaction, event data such as maintenance and usage and local weather data coming from the locally installed weather stations to map the unique local climate of an enclosed stadium pitch and calculate its effect on plant health and growth.
Today, Raw Stadia’s Embedded Analytics is available to their end users, enabling them to navigate through their data and find the answers to any surface related questions. Custom calculations based on surface and weather data are made available to assess the turf’s disease risk, growth potential, injury risks and expected performance outcomes.
Right now, they’re getting into a phase of optimization, aiming to make Tableau a reliable feature that all their customers can access (scale up).
Get started with embedded analytics
Got a similar use case in mind? Or simply want to get started with embedding analytics to increase revenue streams or improve user experiences? Let’s discover how you can get started together with our Embedded Lab.
Get in touch for more information.
Let's talk