Belgium is the greatest cycling country in the world. We have Eddy Merckx, the greatest cyclist ever lived. Our Ronde van Vlaanderen en Liege-Bastogne-Liege are two of the only five cycling monuments in the world. And in summertime al lot of Belgian's decide to spent their holidays in France to support their favorite cyclists during the Tour De France.
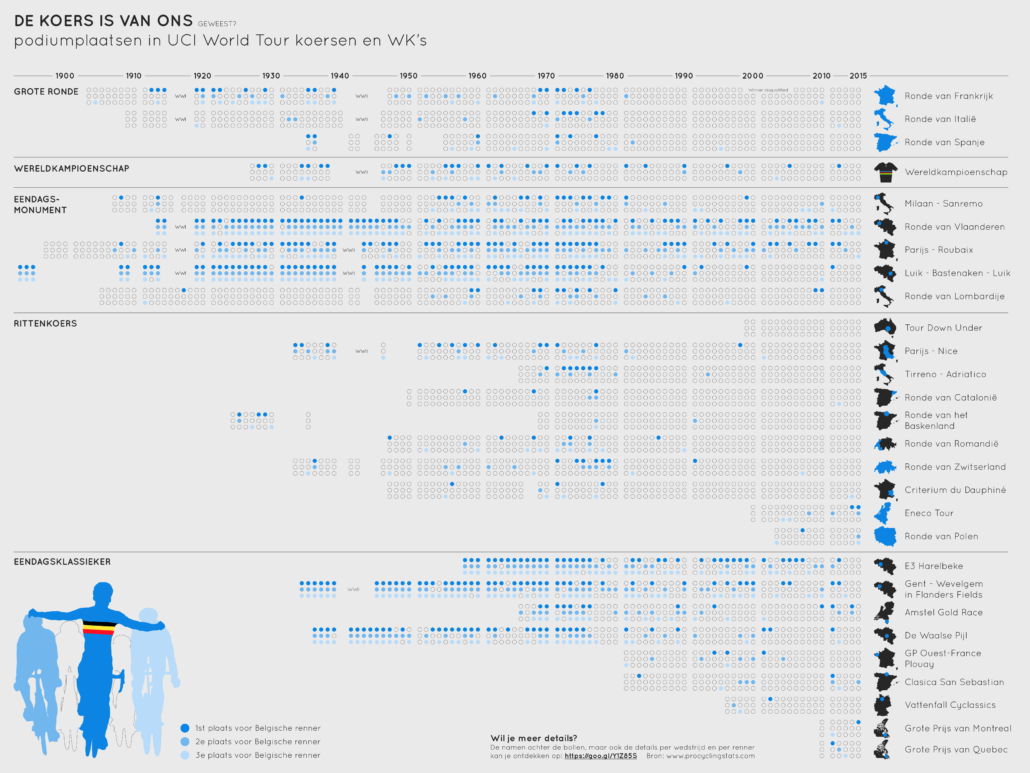
Since I'm Belgian, of course the cycling virus also affected me: cycling is the most important unimportant thing in the world! However as a data fan I was curious to know how good we actually are in cycling... Therefore I decided to analyse all podium places of all UCI World Tour races (competition that includes the 28 most important races worldwide) since the first time they were organised. I selected all of the Belgian podium places and plotted them against a timeline from 1892 (first race) till now. You can see the result below. (in Dutch). The conclusion: during the 60's and 70's we used to win almost everything. However in the last decades, our succes is rather limited to the one-day classics of the north...
This visualisation was made in Adobe Illustrator, but to help me analyse the data I made use of Tableau software.
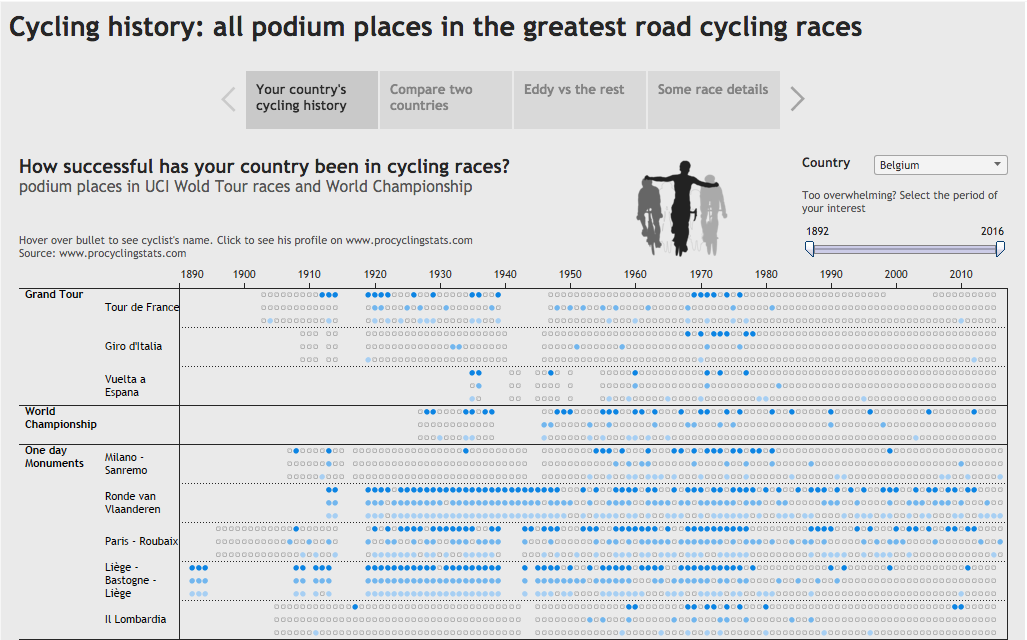
The nice thing about Tableau is that, once the data has been connected you can endlessly play and visualise it. With the use of filters and parameters you can let the data tell the story you are interested in! Therefore, I decided not to stop with my 'Belgian' story. I made some additional visualisations which make it possible to see the results for other countries, discover who are the other great cyclists next to 'our' Eddy and dive into the details at the race's level.
And this is the result: a sort of visualised cycling history encyclopedia!


