A problem I encounter sometimes when working with customers, is the problem of plotting streets on a map in Tableau. Of course, no problem! Do you have longitudes and latitudes for these streets? No will be the most common answer. Double-clicking the street names in Tableau does not have the same behaviour as a country, state, ... because no geographical role can be attached to street names.
After looking into different options, I came across the Google Geocoding API. Using the power of Google Maps in order to plot streets on your Tableau map, imagine that. Well, using this very easy Alteryx flow, this becomes reality. Disclaimer, this API has a usage limit of 2500 calls for free.
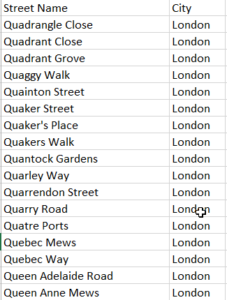
The starting point for this exercise is an Excel with 2 columns: the street name and the city name. In our example, we will be using a file containing all the street names starting with the letter 'Q' in London. No longtitudes nor latitudes are available off course.
The first step is to generate a Geocoding API Key. Follow these steps:
- Create a Google Account if you don't have one already.
- Go to the following link (https://console.developers.google.com/apis/) and go to the Google Maps Geocoding API (under Google Maps API's).
- Create a project
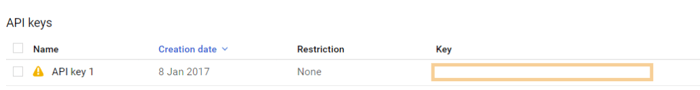
- Go to the Credentials pane (on the left) and generate your API key. You should have a view like this:
When the API key is generated, it's time to open up Alteryx.
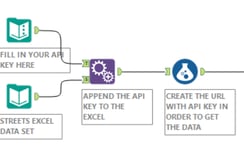
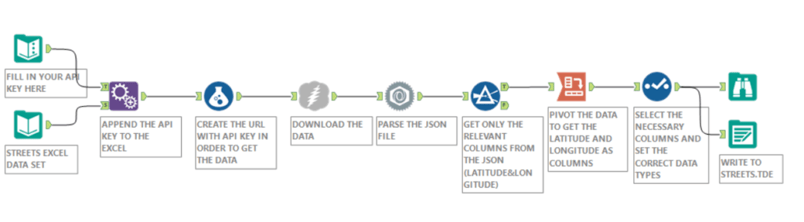
Create a new flow or download the prepared flow below. The first step is to compose the URL needed to reach the API. This is done on basis of a fix part, the part of the adress and the API Key. In the text input file, the API key needs to be filled in (this is the key you generated above). This API key is appended to the Excel containing the streets. Afterwards, the URL is created. This is done in the following part.
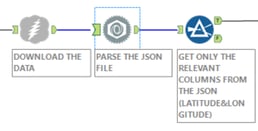
The next step is to download the data from the API. The response the API gives is in JSON format. It is possible to parse a JSON file within Alteryx pretty easy using the JSON Parse tool. Afterwards, the only relevant columns are filtered out of the parsed JSON file (the longitude and latitude). This is done in the following steps.
.
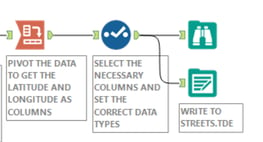
The final step is to make the latitude and longitude into columns instead of rows (this is now the case). Before writing the .TDE file, a select tool is used to select only the necessary columns and to change some data types. The final step looks like this.
Finally, this is what the whole flow looks like.
After the Alteryx flow is built and the .TDE is created, open Tableau and connect to Street.tde.
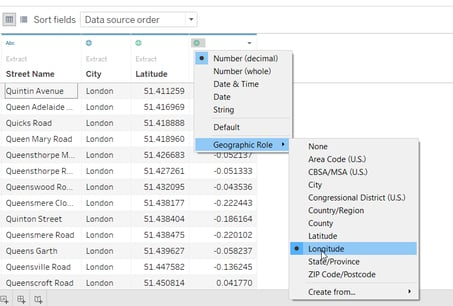
First some data prep should be done. Convert the longitude and latitude field to Number(Decimal) and add the geographical role longitude and latitude to the columns. Like this:
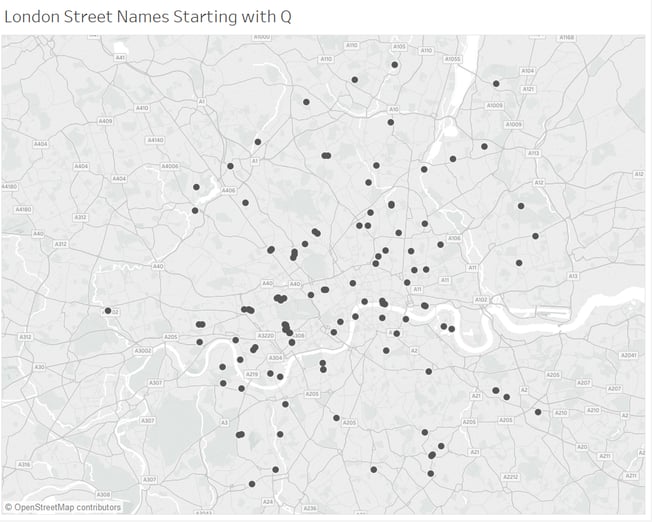
When this is done, open the worksheet. Drop the longitude column on columns and the latitude column on rows. Afterwards, drop the Street Name column on the detail mark.
Voila, all the streets starting with 'Q' in London are plotted on a map in Tableau using the Google Geocoding API and Alteryx;
Hopefully this will be helpfull. The content can be downloaded here.