Legacy data stacks drive inefficiency. Time to dsay goodbye...
Within every company, there is a multitude of diverse data sets scattered across various platforms. This can include data generated by different teams, as well as the use of different software throughout the organization, and so on.
The question that arises is: How can you consolidate all of this data into a single location and make sense of it all? When you contemplate the numerous data points spread across your company, it can be quite overwhelming to find a solution to this question.
In this article, we will delve into the concept of breaking down the data silos that exist within your company.
Let’s dig deeper!
What are data silos and what is their impact?
Data silos are isolated repositories of data within an organisation that are not integrated or shared with other systems.
Data silos typically occur when different departments or teams within an organisation use different software systems or databases, making it difficult to share data and collaborate effectively.
Take a payments company for example; the finance team will likely use systems that are best for them to help them understand the business and support them in their day to day operations.
The payments team, however, will probably have different needs and different tools - that are likely not integrated with the systems of the finance team.
That’s a problem.
The payments team might have a different number of “total payments processed” than the finance team - as the finance team will only count the number of payments that succeeded and the payments team will also see the ones that failed.
Data silos can lead to inefficiencies, duplication of efforts and inaccuracies.
They make it harder for organisations to gain a comprehensive understanding of your operations and customers.
So, how do you break down these silos?
Removing data silos through data centralisation
Usually, data gets centralised in excel spreadsheets. But that’s bad news. Spreadsheets are also siloed within itself.
The good news, however, is that we’re living in the modern era today.
And there are alternatives… YES!
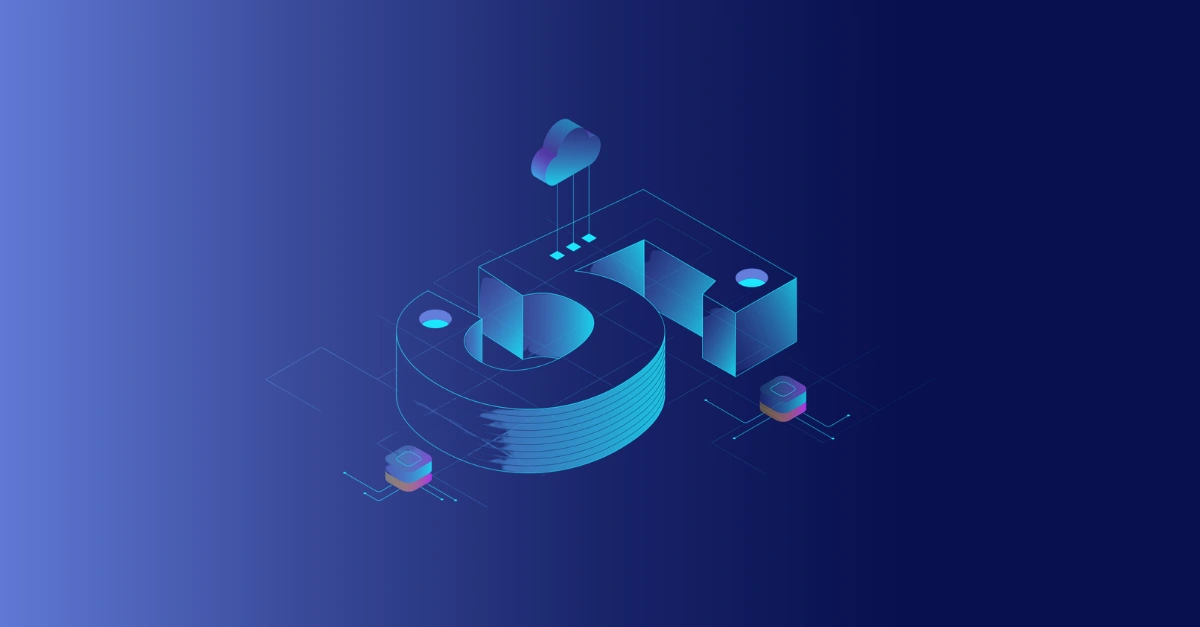
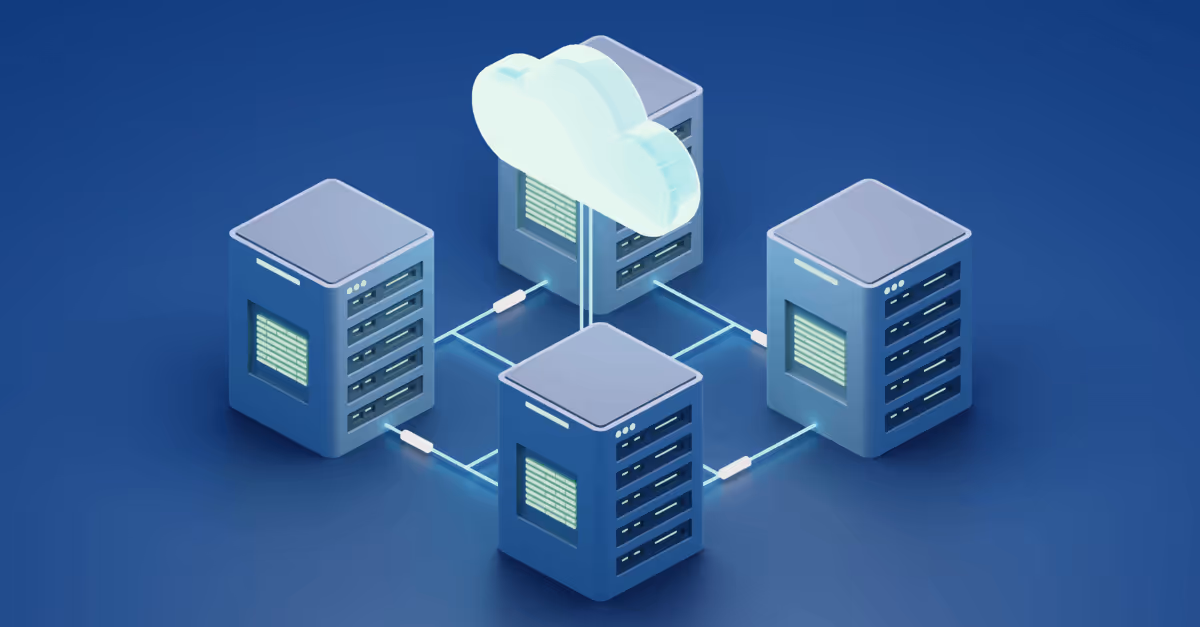
Here at Biztory, we use Snowflake to centralise data in a cloud data warehouse. This allows different teams and different organisations to have their data all in one place.
With an administration team looking over that, you’re able to control administration and who’s able to access what data.
A data warehouse like Snowflake is a very useful place to house everything, as it lowers the bar for having to manage access control and makes your data available to you all the time.
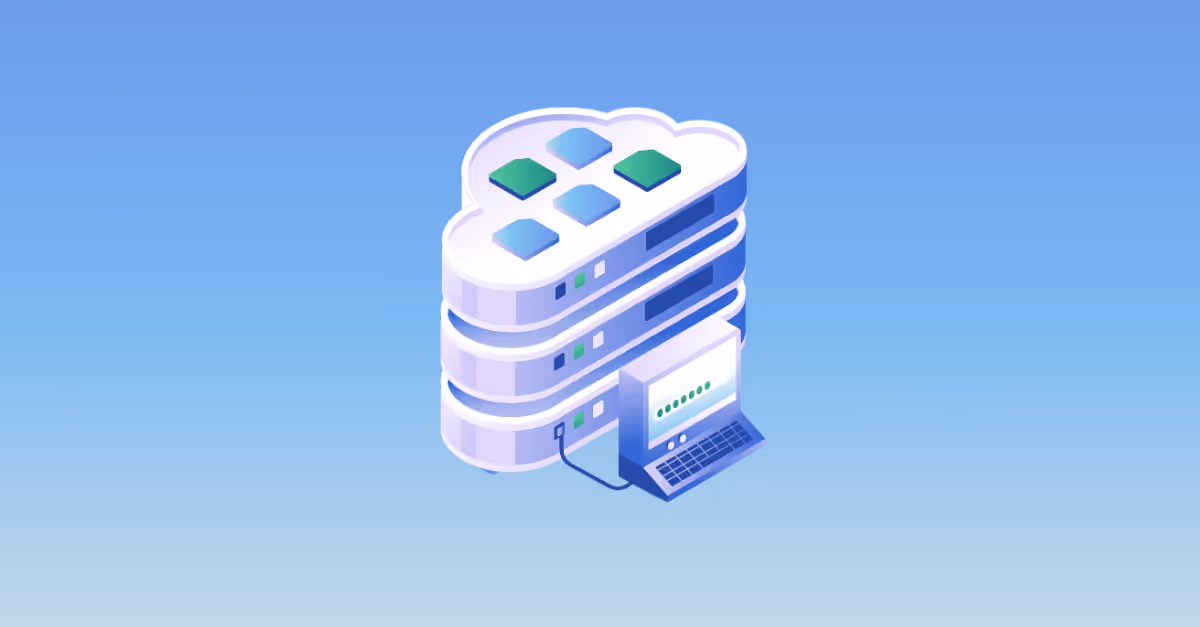
Break down data silos with automated data pipelines to your cloud data warehouse
Alright, that all sounds very good. But the main question you’re probably asking yourself at this point is:
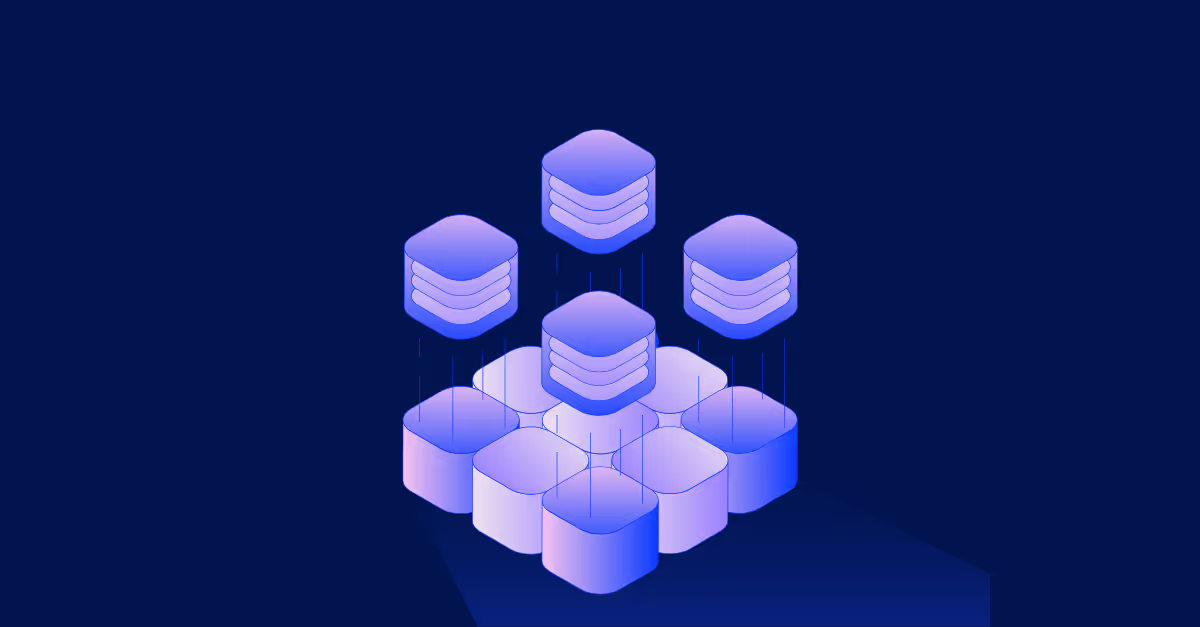
Data is moved and modelled into, within, and out of your cloud data platform. Modern data needs like this are being met more and more with a cloud data platform.
Here, data is being ingested by a variety of cloud / on prem databases, applications, events, etc into one or more cloud services that can handle the different types of workloads that they need in order to run.
Data movement like this can be pretty complex, but equally important too. That’s why you need a tool like Fivetran or Rivery as a part of your modern data stack infrastructure.
These platforms support automated data pipelines for diverse data movement needs - in real time - without compromising security and compliance.
Let’s look at the process.
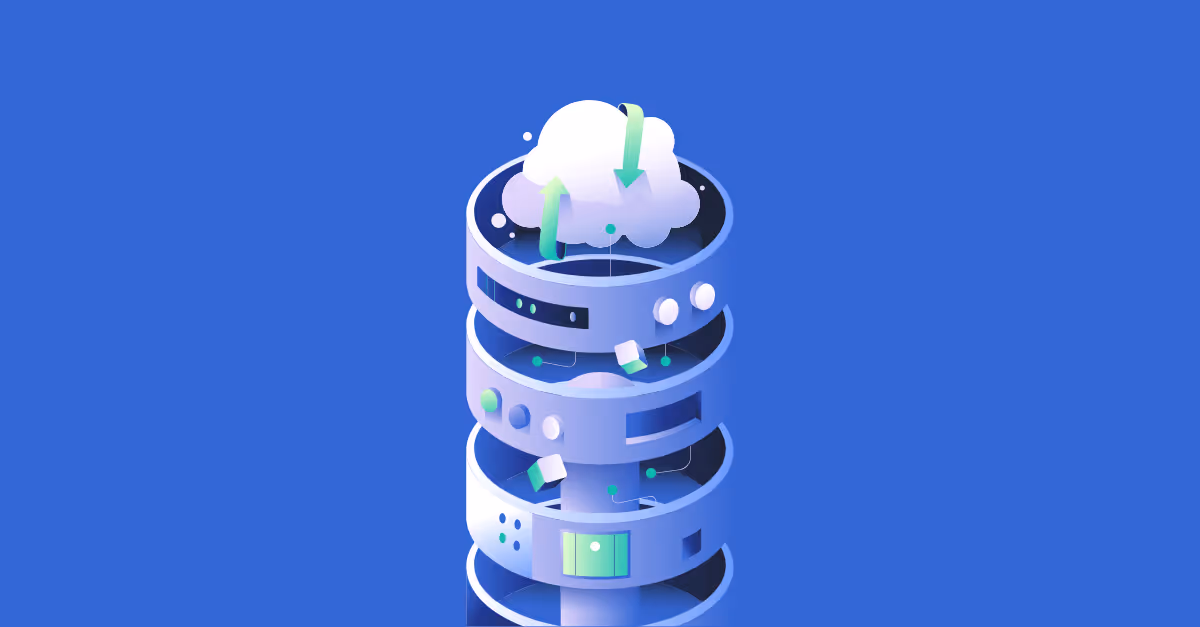
Step 1: Extract data from the data sources

Obviously, the process starts with the data sources itself. An ELT-tool like Fivetran offers 300+ pre-built connectors that allow you to extract data from the source automatically.
And it gets even better… With their out-of-the-box deployability, connections to new sources can be set up in as little as 5 minutes. No engineering or code required.
These data extractions include an initial historical load of all your data that exists in the source.
Step 2: Load data into the destination
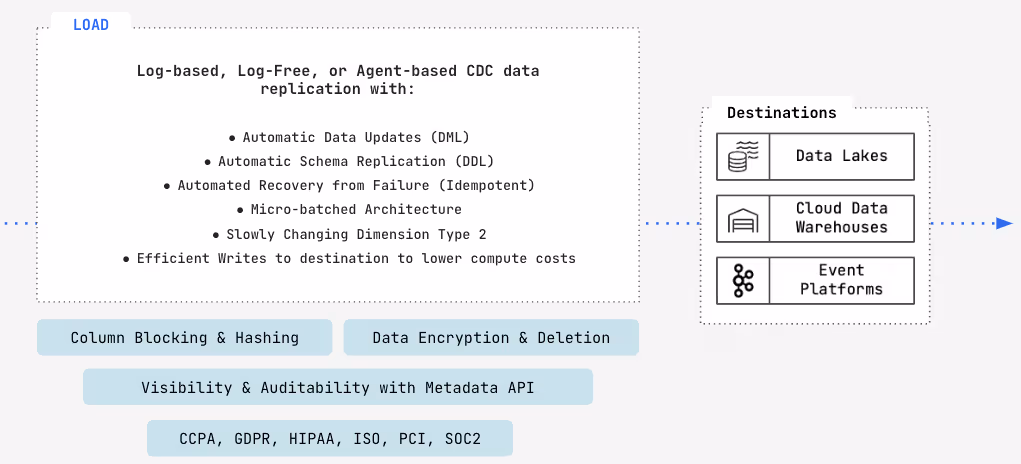
That automation continues through the load process. After the initial load, Fivetran scans for incremental updates, resulting in you having the freshest data possible at your fingertips.
As that data is moving behind the scenes, Fivetran also normalises that data to schemas in your destination (warehouse, data lake, …) through data type mapping and underlying table creation.
Next to that, automations are also happening at the level of data governance & security. Fivetran encrypts the data as it moves, and deletes it as soon as it lands in the destination.
Step 3: Data transformations
The same level of automation also happens at the transformation level of this process.
Before making your data analytics-ready, you can use Fivetran’s pre-built data models to transform your data and produce trusted data sets faster.
Data is centralised… What’s next?
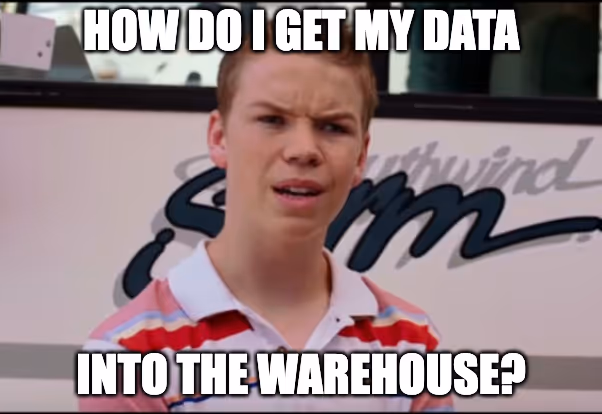
Okay… You’ve got your data centralised.
The raw data has been ingested into your cloud data warehouse, but how do you make sure that people are aligned on what the data means?
Let’s look at a quick cartoon that explains what we mean by that:

In this cartoon, both people are technically correct. They’re just seeing the data from a different angle - like the example of the payments team and finance team in the payments company I mentioned earlier.
The payments team might see X amount of payment going out, while the finance team might see Y amount going out.
To prevent this from happening, you need a data transformation layer in your Modern Data Stack infrastructure, to really centralise that kind of data logic and make sure that when you’re moving forward with these next steps, everyone is on the same page.
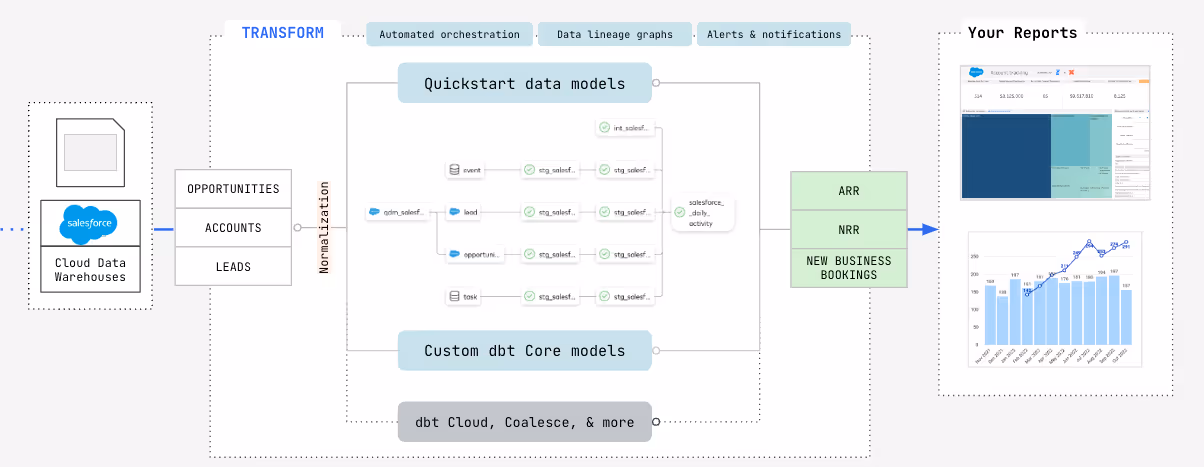
Step 1: Transform
Data transformation happens in a tool like dbt, which is a SQL code based development tool. SQL is the most widely used coding language, and relatively easy to learn - which in its turn lowers the entry bar for data transformation.
dbt also integrates with Git. So, any updates to your code are automatically tracked, making it easier to make changes and keep a log of historical changes that happened before.
Step 2: Document
Provide documentation around the transformations that happened, to explain the meaning and logic behind them.
Documentation also helps with achieving consistency in naming conventions and helping new end users or analysts understand what has been done in the past, to get a certain data set to this point in time.
Further to help with that is this Lineage graph:
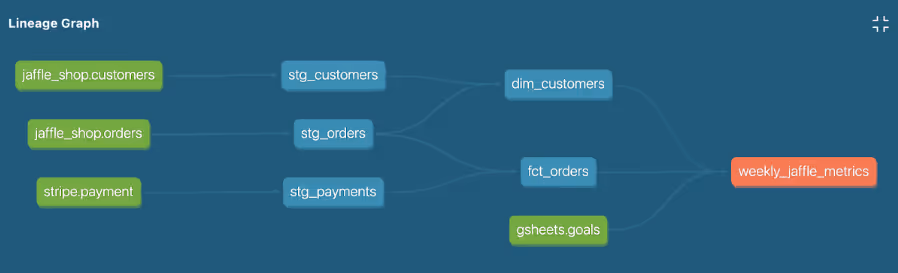
In this example, you see the end result of a table named: “weekly metrics”.
As an analyst, you want to understand where that data comes from. This lineage graph shows you that the very first step in that is coming from the shop.customers table, the shop.orders table, the stripe.payments table, and the sheets.goals table.
These tables go through different steps and are then joined together to produce this weekly metrics table.
Step 3: Building your desired data culture
There are four key components to building a desired data culture within your organisation.
Making data-driven decisions:
At each level within your organisation, what and how are decisions being made? Is it based on gut feeling? Or is it actually by looking at the data underneath?
Tools and resources:
How much is your business and your organisation focused on having the right tools and resources in place? For example, by implementing a Modern Data Stack Infrastructure you have a toolstack in place that really helps you to enable data culture across the business.
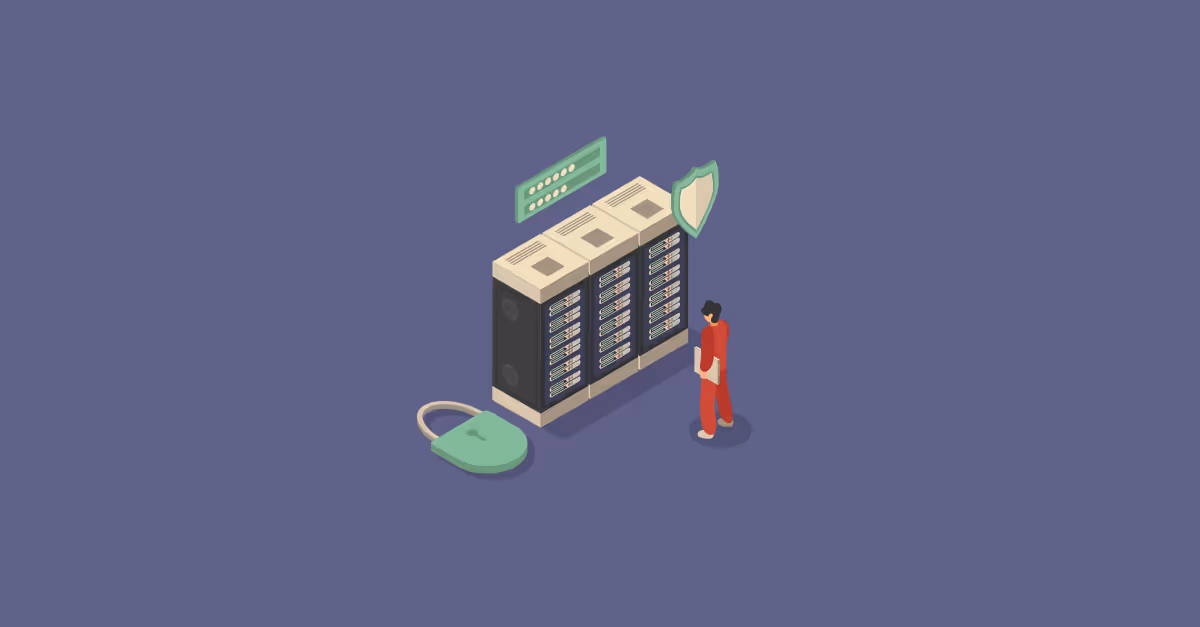
Data Governance:
Making sure your data is secure and trustworthy is another crucial pillar of data culture. Data governance refers to the processes, standards and policies put in place by organisations to ensure the proper management and use of their data.
Key elements of data governance include defining who is responsible for what data, how data is managed across the business, how it’s accessed and distributed, and how it's used.
Ultimately this is implemented with the aim ensuring appropriate access to reliable, consistent and secure data, while removing data silos.
Leadership:
A lot of the above is driven by good leadership. How does leadership want to prioritise data, how would they like teams to access and work with data, and what does data democratisation actually look like for them?
Summary
Essentially, go start with mapping out all your source data. By using automated data pipelines from a tool like Fivetran, you push this data into a cloud data warehouse like Snowflake. Tools like dbt then help you to transform this data so that you can produce trusted data sets for your team.
End users will then be able to access that data in analytics tools like Tableau and ThoughtSpot to make better data-driven decisions based on their analysis of that data.


.webp)