
Tableau is a powerful data analysis tool that offers users countless opportunities to add interactivity to their data and the way it is displayed in the final analysis. One such feature that provides more flexibility when it comes to parameter functionality and designing dashboards is Multiple Select Parameters.
What are Multiple Select Parameters in Tableau?
Multiple Select Parameters allow users to choose multiple options at once, just like multiple select filters. However, the current limitation with Tableau parameters is that only one selection can be made. Users have been requesting more flexible parameter options from Tableau's developers, and multiple select parameters may be available in a future Tableau release.
But, what if you want to use Multiple Select Parameters right now? This blog presents a simple method of creating multiple select parameters using parameter actions and formatted sheets. Similar blogs have discussed how to do this, including Marc Reid’s blog on creating a selection panel which describes use cases in great detail.
By following these steps, you can add more interactivity and control to your analysis, allowing the end user to choose the way in which the data is displayed, as well as the information they want to view.
A Use Case for Multiple Select Parameters in Tableau
In Tableau, parameters are often used to replace a filter, a calculation, or a constant value of a reference line in a graph or dashboard. With Multiple Select Parameters, you can provide even more control and flexibility to the end user. So, if you're looking to enhance your Tableau analysis and give your end users more options, follow along with this blog to learn how to create Multiple Select Parameters in Tableau.
The Superstore dataset
Using the Superstore dataset, suppose we want to compare various sub-categories to one another and also to the remaining sub-categories. Employing multiple value filters does not allow us to do this because the filter removes the unselected sub-categories from the view. However, by using a multiple value parameter, we can compare the chosen sub-categories while keeping the unselected values visible in the view and comparing them to the chosen sub-categories. Another way to do this without using multiple value parameters is to use Set actions as explained in this blog.
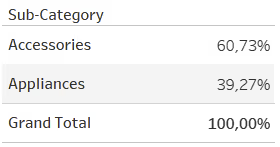
As shown in Screenshot 1, using multiple value filters allows us to compare Accessories to Appliances. However, the percentage only reflects the difference between the two sub-categories of Accessories and Appliances.
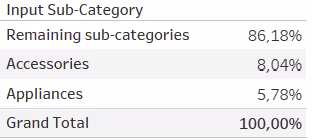
On the other hand in Screenshot 2, utilising multiple value parameters enables us to compare Accessories and Appliances to the remaining sub-categories.
How to Create Multiple Select Parameters
Using the sample superstore data in Tableau, we will build a simple table of sales for sub-categories in the year 2022.
Step 1: Build the Visualisation
For this we will need two sheets. One for the sub-categories sales table (“Sub-Category List”) and another one for the parameter values which will serve as a button list (“Parameter List).
Step 2: Create a String Parameter
Create a new parameter from the data pane. We will use the Sub-Category dimension as the multiple select parameter for this tutorial, so let’s create the parameter [P.Sub-Category Input] as follows:
![How to create multiple select parameters in Tableau: [P.Sub-Category Input] parameter setup](https://cdn.prod.website-files.com/68629a68850f54ad8b61f4a5/68fb7824b7dc57a33712c02a_hr2PWS6-NGMiQ960sTU9LZFaggj1LXvKtJYreK2Y6iIxpsTbHkeY0KePs6U4CkrBqhyom6F0iQcNzyktoo4wd-ZZRaPMWkpW0pJpEkXdEpuOHeo7giRU9_de0B5ns0jkV9wBVluSXZd7rj4QiwFovdg.avif)
Keep the parameter empty because it will be filled with values from the button list that the user will interact with.
Step 3: Create Four Calculated Fields
These calculations will be used in our sheets.
1. Sub-Category Input Contains
![How to create multiple select parameters in Tableau: [Sub-Category Input Contains] calculated field](https://cdn.prod.website-files.com/68629a68850f54ad8b61f4a5/68fb7824b7dc57a33712c02d_PmXCKeD141Wr5nvkb-2bKofVnEiNLhUzYGqXJgwNOOWmmhVfz4ZNalyAMVD2dnOoMsxhds9k_QbxWOFaSuOkF7bqnBWe-0aoA2f3lgGknvZ8xQP306sTaxLKV8ROS1Yull1_0hIGH6CWclsOmIQ84Nk.avif)
This calculation will drive which Sub-Category selection is being made. The contains function looks for the Sub-Category values inside the [P.Sub-Category Input] parameter. This calculation identifies if a member is in the parameter or not. This field will serve as an input list with multiple values to choose for the user and also a legend, as the selected value will be highlighted with a colour.
2. Sub-Category Input Action
![Creating multiple select parameters in Tableau: [Sub-Category Input Action] calculated field](https://cdn.prod.website-files.com/68629a68850f54ad8b61f4a5/68fb7824b7dc57a33712c052_ed66UZuXrcNOcnLfvrRHDwwSUqI8uYHYfvTknLHkuk7tMja2HzzVu8rq4iUe3OnjsQn0l1Hd3jtdSt5UcDm10yxv76lbGQ5dOIDx59f1Y0fYUiUu6poKqSVaCst-ma_q7jPWWPpf4rxkuFrt7d3M3qo.avif)
This calculation will be applied to the parameter action used on our dashboard later. If a member of Sub-Category is in the [P.Sub-Category Input] parameter, then it will remove the value. If it is not in the parameter, it will add the value to the [P.Sub-Category Input] parameter string. It will also drive the selection/deselection of parameters on the dashboard.
3. [True]
![Multiple select parameters in Tableau: [True] calculated field](https://cdn.prod.website-files.com/68629a68850f54ad8b61f4a5/68fb7824b7dc57a33712c04f_C3r93iA-cYG7yk2cqQ8Q_dC49jrWURv8oGpmAtxnFhBRCUNaAa7r_HFQp6uaV6aX3s_WPw2RYAmu9lYmC5_CaEUYIfYhCAq4Il2MfQhqrFhBIiKakNI6eUHPPxXpl0_oU0e2Za0CGgZjafrV54_JNvg.avif)
4. [False]
![Tableau Multiple Select Parameters - [False] calculated field](https://cdn.prod.website-files.com/68629a68850f54ad8b61f4a5/68fb7824b7dc57a33712c03a_2Q4R1jzP0KJAaneZRbuiXNz45QbWzLcukBoyFaol3bes4noDjCb7_bNBwXyE5cDAp916o5gNbXtWdwhPNFO1vglbhExT-Ir9Qu_hnNqkdoUNRc-A6uKEjjCr5ZpLuA5KJ5EKaMz1Z4vOU5yVf3REgz0.avif)
The [True] and [False] boolean calculated fields are needed to give the feeling of a button for the parameter value list.
This technique automatically removes text highlights to give the feeling of a button. This is where the two fields we created, [True] and [False] come in handy.
Step 4: Build The Sheets
We have two sheets to be created for this dashboard:
Sheet 1: “Parameter List” Sheet:
This first sheet will be used to build out the parameter selection list and will serve as a colour legend as well.
- Create a new sheet and rename it to something like “Parameter List”.
- Drag [Sub-Category] onto the rows shelf
- Drag [Sub-Category Input Contains] that we created in step 3, onto the colours mark
- Drag [Sub-Category] onto the text mark
- Drag [P.Sub-Category Input], [Sub-Category Input Action], [True], and [False] fields onto the details mark
- Also, create a new field SUM(1) and drag it to the size mark, and increase the size to the maximum.
- Set marks type to Gantt Bar
The marks card should look something like this:

Now, format the parameter list as follows:
- Set the label text alignment to centre.
- Untick show header.
- Remove grid lines.
- Click on the colour marks and add a border.
You will be able to see something like this:
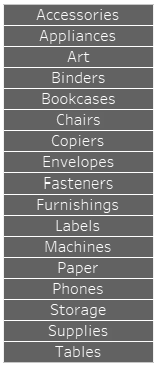
Now this is a clickable multi value list that the end user can use to select one or multiple sub-categories.
Sheet 2: “Sub-Category List” Sheet:
To build the second sheet, follow the steps as outlined here:
- Drag [Sub-Category Input Contains] dimension to the rows shelf and drag the sales measure to the text mark. Note: at first you will get only NULL because no value is chosen from the parameter. Change the NULL alias to something more meaningful like “Remaining sub-categories”.
- Add a quick table calculator for the sales measure as the percentage of total sales.
- Add column grand totals from the analytics pane.
Step 5: Build The dashboard
Add both sheets we created onto a single dashboard. Design them as you see fit.
Add the parameter [P.Sub-Category Input] to the dashboard.
Step 6: Create dashboard actions
After dragging the needed sheets to the dashboard. Now it is time to create two parameter actions.
1. Parameter List Action
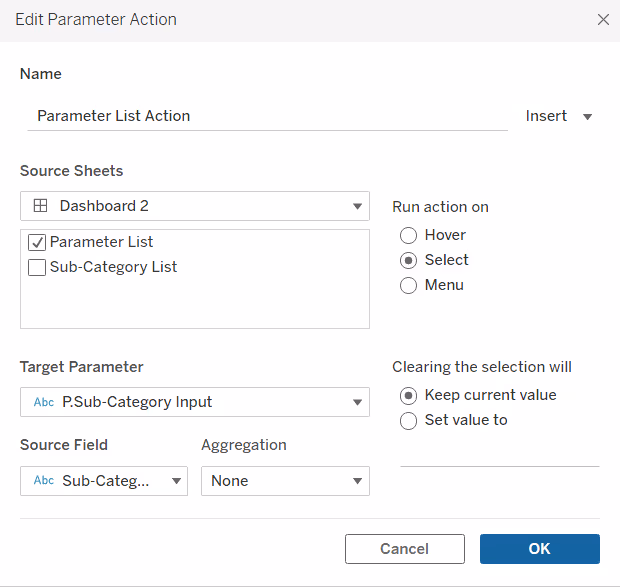
This parameter action feeds the parameter with the values clicked from the parameter list.
2. T|F Filter Action

This filter action is to automatically remove highlighting when selecting or deselecting values which will give the feeling of a button to the gantt bars of the parameter list.
Final Result
That's all! You should now have a dashboard that includes various selectable values. By clicking on one or more values from the parameter list, you can observe how the sub-category list automatically updates accordingly. You can also utilise this method to compare the sales numbers of sub-categories in a line chart.

When you click on the buttons, they become highlighted, serving as a colour legend. Clicking the same button again will deselect it and remove the colour. This enables us to have a dynamic parameter that supports multiple values.
Multi-select parameters are essential for Tableau. While they are not readily available, anyone can create them using sheets and parameter actions. Having multiple value parameters provides end users with more interactivity and freedom in selecting measures and dimensions.


.avif)


.avif)