Introduction
After a few years of being a Tableau analyst and consultant, I have slowly drifted into the more technical realm of Tableau Server, DataDev, and other topics that don’t always pertain to analysis and dashboarding. Nowadays, I even find myself working in product development, specifically Biztory’s TabMove solution at this moment in time.
This is all very interesting, as I have a background in IT and definitely also a passion for automation and integration. I get to piece together various types of data flows, connect different platforms, and develop all kinds of things that make lives easier and do cool stuff. But I do have to admit, I find myself missing dashboarding, data viz and analysis work from time to time.
A New Opportunity
Thankfully, only a few months ago, a new opportunity arose for me to do some dashboarding work as a new client entered the scene. Our expectation was that the client might be relatively demanding, that they might require a significant amount of attention and care, but that the return from working with them would be considerable as well.
I accepted the challenge, and the first dashboard we developed was very quickly put in production and adopted by stakeholders in their day-to-day operations. Rapidly, feedback was provided and the utility of the dashboard became apparent. What’s even better: the client agreed to have the dashboard showcased publicly, so I can share the work we’ve done here with you. A screenshot of the dashboard:
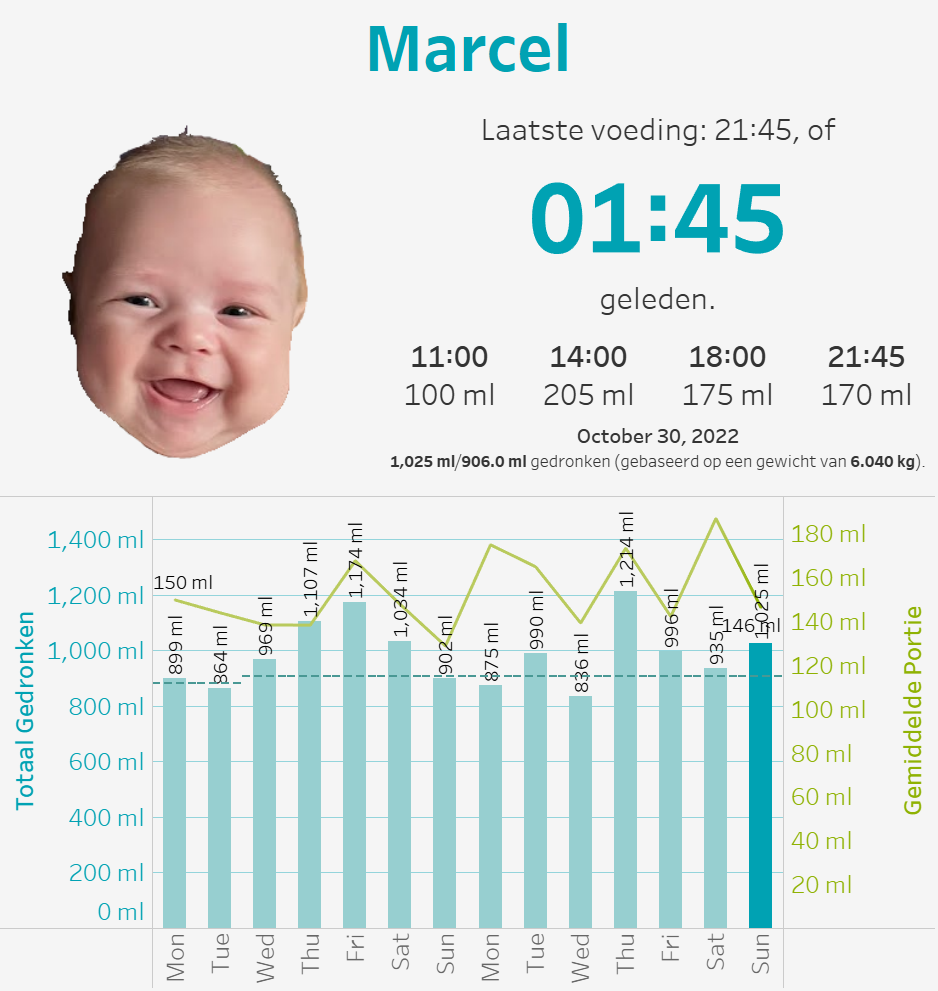
It’s in Dutch, as it’s a household-use dashboard, but you might be able to deduce what it’s for from the content. Try and guess…
Revealing The New Client’s Identity
Maybe you’ve guessed it: the new client is in fact Marcel, our new born son. The data in the dashboard is his milk intake, which we’re tracking as apparently, that’s what you do! The idea is that we can follow up on whether he’s had enough to drink on a daily basis.
On top of that, the dashboard is displayed in our kitchen and Marcel’s little photo indicates how long it’s been since he had a meal, and whether it’s time for us to serve up the next one. Here’s what he looks like when it’s been a bit longer since he’s had milk…
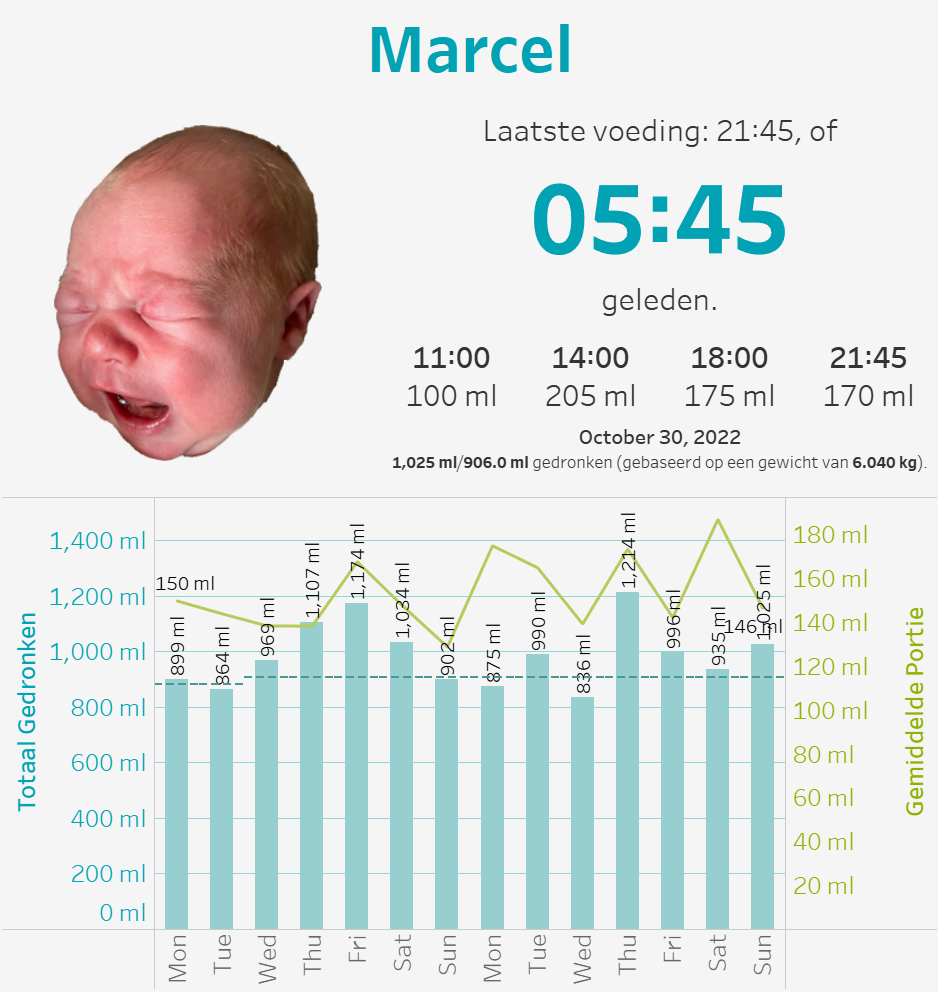
Yeah, he’s not so happy now… please don’t call child protective services, it’s the middle of the night and he’s sleeping!
Why Are You Telling Me This?
Well, I think this fits with a topic that I’ve always been passionate about, and that I’ve advocated for frequently in the past years. The gist is: in my opinion personal analytics are fun, a great way to learn, and they make for captivating stories. Why?
- It’s fun, because you’re working on data that you have a personal connection with, and supposedly will be interested in. I’d hope so, at least! Pick your favourite hobby and try to capture data around it!
- It’s a great way to learn, because you’re your own stakeholder and you are not held back by knowledge of business or field.
- It makes for captivating stories, because your closeness to the data should allow you to tell the insights you’ve captured with more sentiment than any other data set. You’ve almost literally lived this data!
What is basically a hobby project can have some actual useful consequences as well. A few weeks ago, Marcel brought home his first viral infection from day care, which I’m told is now basically going to happen all the time. He was not feeling very well, and would eat less and less after a few days. We went to the doctor’s, and were able to provide them with useful data on what had been happening around that time:
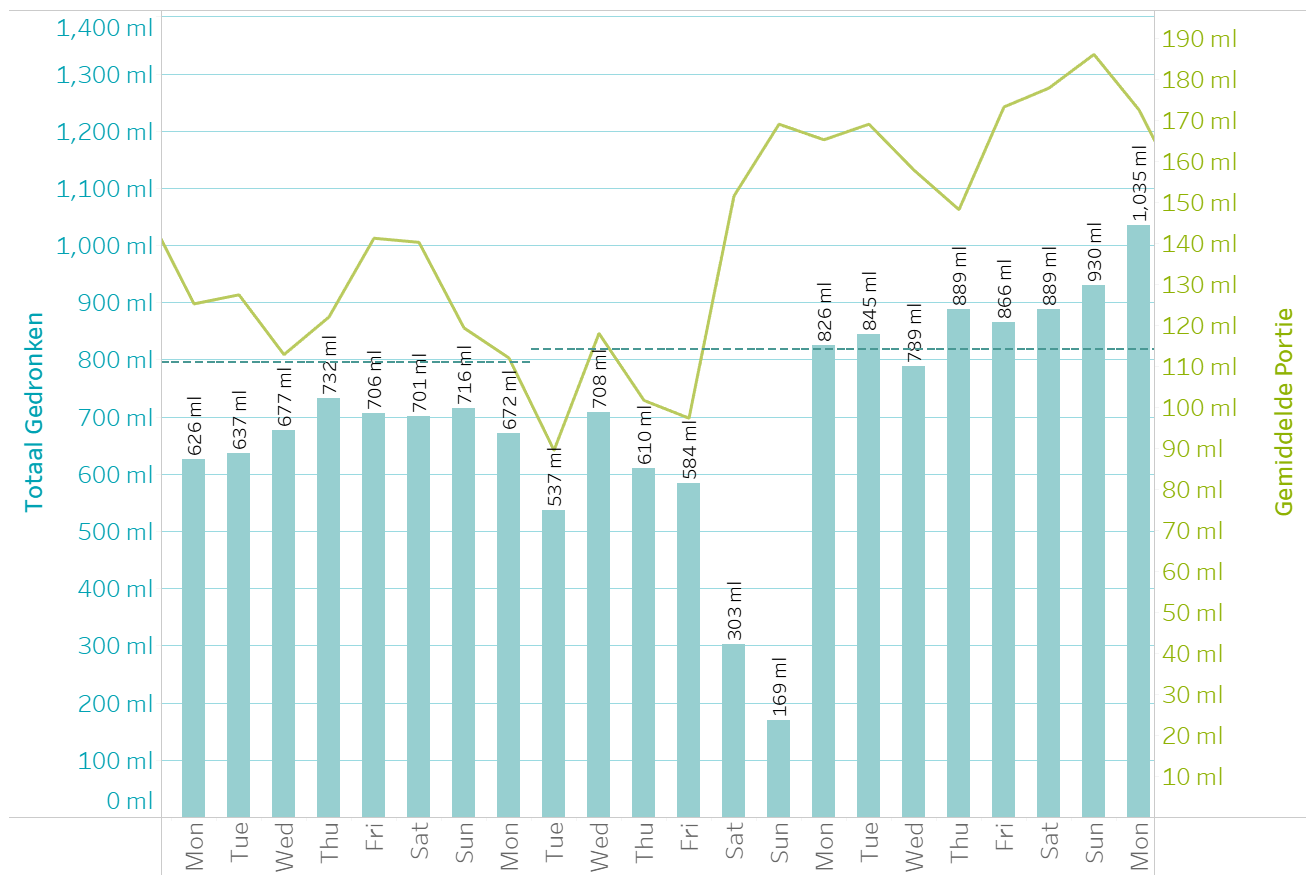
The significant dip in the centre there is when he was not feeling well. And as you can see, he definitely made a full recovery afterwards!
Your Data!
It’s your turn! Why not take a moment to think about which personal data you could be capturing, and what you can do with it. It can start really, really simple, and bringing that data into Tableau should be a fun way of discovering what other things you might want to track or learn.
And: it’s 2022. There’s a good chance you’re already recording data you can use for personal analytics. Personally, I use my Strava data to see how I’m doing running-wise. You might have a bunch of smart devices already saving all kinds of data you might be interested in. Go, learn, and try and find a fun story in there!