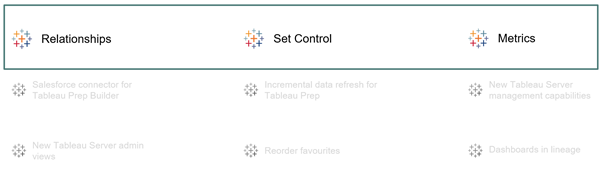
Hello! Welcome to our super-quick round-up of the most exciting new features that arrived with the latest release of Tableau desktop, Tableau 2020.2! We’ve written this post as an accompaniment to the webinar we did on Tableau 2020.2 features, so if you haven’t already seen that –go check it out! It’s packed with detailed explanations, top tips and useful use-cases and live demos to help you get up to speed on the latest developments in the Tableau world. In today’s post, we’re going to give you a quick summary of the top new features we’ve cherry-picked from the bountiful crop Tableau 2020.2 brings us. So, stay tuned for a quick summary on all-new Relationships, Metrics and Set control improvements!
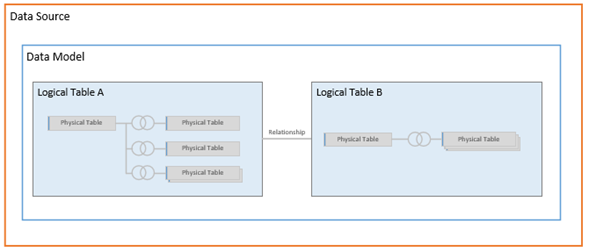
So, let’s get into it! If you’re not yet acquainted, allow me to introduce you to the star of the show – Relationships and the new Tableau data model. How do Tableau Relationships work? Put briefly, the new data model brings a host of brilliant functionality you can leverage to harness the power of your data – with more ease than ever before! From top-to-bottom, the new data model harnesses the power of the noodle. That is, you now specify a somewhat 'arbitrary' connection between tables on the data connection pane, as denoted by the flexible line between the tables – or ‘The Noodle’! You also have access to optional tuning parameters (cardinality etc.) which allow you to specify the type of relationship for performance purposes, but otherwise, Tableau specifies the join-type dynamically when creating the viz.
By doing this, we can preserve the level of detail used in the original tables and can change this dynamically, based on the view we are trying to create. That said, if you’re worried about backwards compatibility or simply have a specific use-case that requires harnessing the old join types, fear not! The new model can interpret typical join types in what we now call the ‘Physical Layer’ in which you can still build your conventional joins and unions. The new data model sits atop this ‘physical layer’, dynamically relating the data sources in what we call the ‘Logical Layer’.
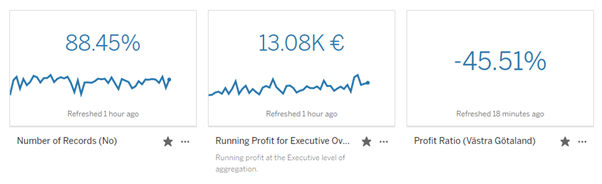
So – that’s relationships. Now what are Tableau Metrics and how do they work? Metrics are a super simple & highly powerful quality of life feature, brand new for Tableau 2020.2. The core concept behind metrics is to create an ultra-refined KPI view of the measurements you’re interested in; from the dashboards, you use the most on your online Tableau instance. With just a few clicks and almost any type of mark, you can automatically generate a KPI view of your selected mark/measurement and save it for ultra-fast (and portable) access. Metrics can save you a tonne of time by bringing the metrics you’re most interested in, to the forefront of your analysis – bypassing any additional configuration or visual scanning.
And finally, onto set controls and improvements to set actions. Now, you may be thinking – set membership control is nothing new – I could do that before. And you’d be right. But the key distinction is that previously you’d have to select membership in a single transaction, crucially now the new controls operate in an incremental fashion making for a far more user-friendly experience and opening the door to a host of exciting new possibilities! Set controls specifically enable incremental set membership alteration akin to conventional quick filters. Set actions complement this and provide you with another way to dynamically and incrementally alter set membership, but this time action-based from the visual itself!
So that’s our round-up of the most exciting new features for the latest Tableau 2020.2 release. For greater depth on the topics covered here, interesting use-cases and live-demos you can watch the webinar online. We also have a heap of other helpful content, tips and tricks and even free skill-ups! If you’d like any more information on the topics you’ve seen here today, please do get in touch.