Finding the Top N by Creating Filter Dependant 'Top vs All Other' Groups
Before we can tackle anything in Tableau, the first thing we need is a list of the "Main" sub-categories for each country. Once we have identified these, we can begin to create our Groups for each respective country.
As you can see, our key sub-categories for France are now displayed individually, whilst everything else is grouped into an "All Other" field. Now that we know this is working correctly for France we can simply replicate these steps for the rest of our markets before tying them all together in the next step!
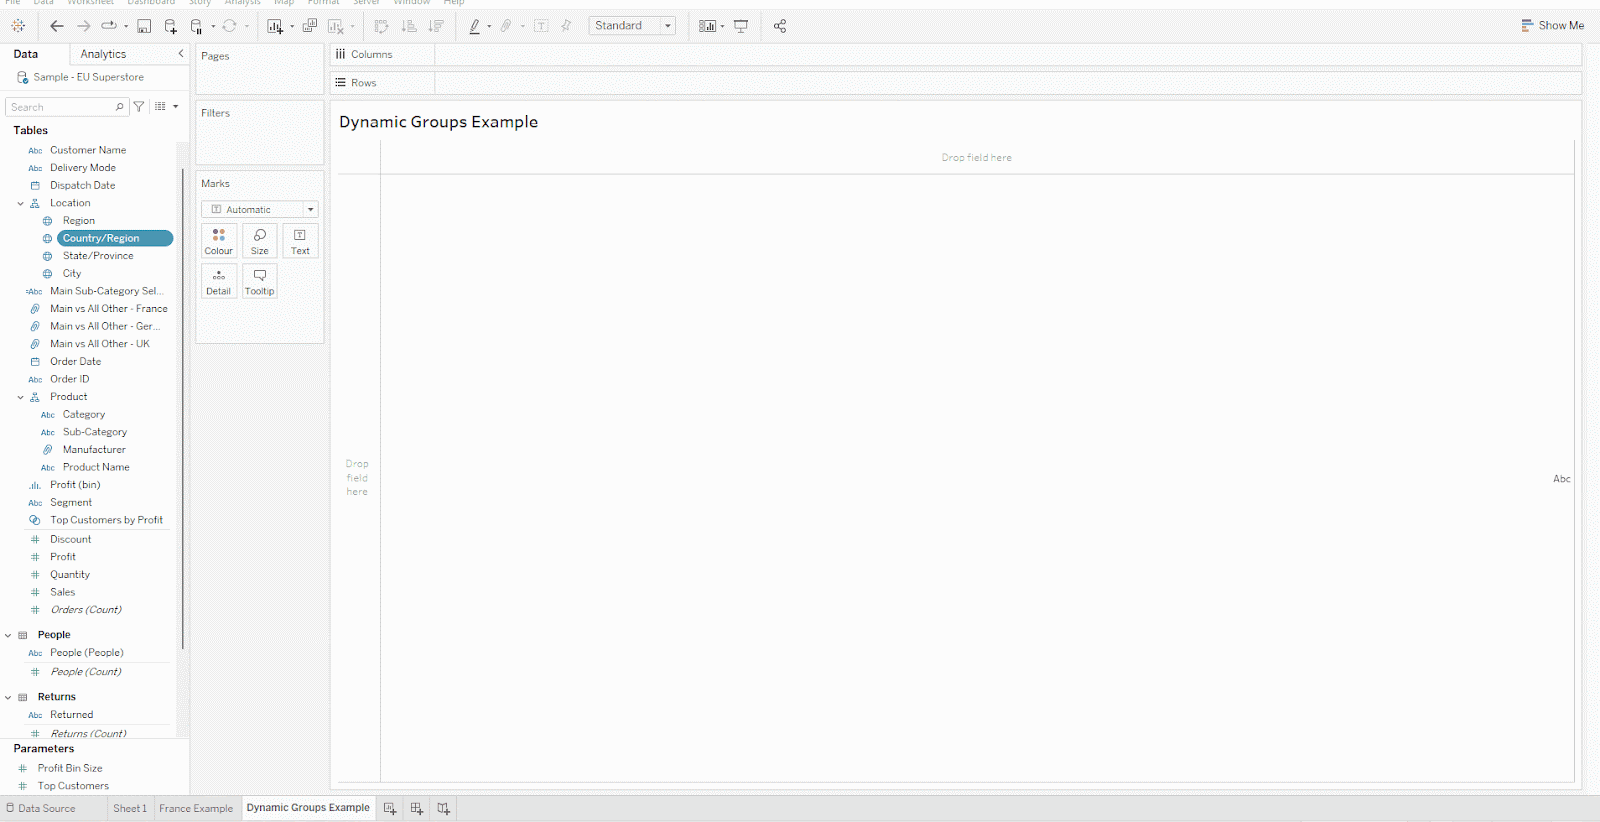
Now that we have created all of our groups, we need a way to dynamically switch them based on the market selected. This can be easily achieved with a simple CASE statement that switches between our Groups depending on the country the user has currently selected.

Finally, once we have all of our components done we can start building our sheet. First we add our Country filter to the page to control the CASE Statement. Then we add our CASE Statement to Rows and Sales to Columns. After any final customisations have been made, we can see now that the list of subcategories dynamically changes depending on the Country we have selected with our filter, as per the customer's request!