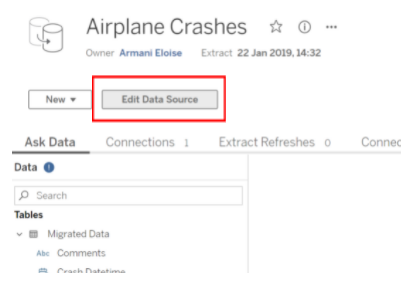
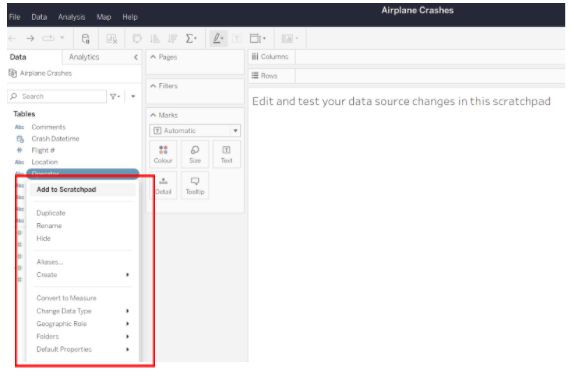
Edit Published data sources on the web
You can now edit published data sources on the web!
Finally, no need to download the published data source to make changes in Desktop and then re- upload. You can also edit and test the data source changes in the scratchpad worksheet view:
If your data source was published by a flow, you will be prompted to edit the data source in the flow to avoid overwriting edits in the next flow:

This feature is available in Tableau Server and Tableau Online.
Replay animations
You can now replay your data transitions from the view toolbar. This saves you from having to reselect items which trigger the animation, e.g., Filters.
Once you have set an animation in your view, you can select the icon to replay:
You will also have the option to choose your desired speed.
This great new feature allows for seamless repetition, especially if there are too many data points to process in one go.

This feature is available in Tableau Desktop, Tableau Server and Tableau Online.
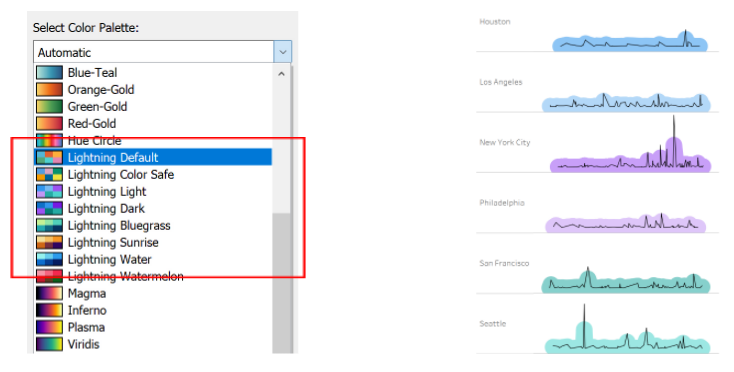
More colours!
With the addition of the new lightning Salesforce palettes, there is no need to update your preferences file for your dashboards. These colours are vibrant and unique – which are of course great to use for non Salesforce worksheets too:
This feature is available in Tableau Desktop, Tableau Server and Tableau Online.
Copy and paste in dashboards!
This new feature is certainly a time saver and will make the dashboarding process a lot smoother!
All those fine formatting details of the item can be simply replicated rather than repeating. This applies to text boxes, images and web page containers.
You can copy and paste across or within dashboards and workbooks.
To paste, either go to File 🡪 Paste, or selecting CTRL + V also works:

This feature is available in Tableau Desktop, Tableau Server and Tableau Online.
Formatting improvements for Parameters in the web
You can now format number and date selections for parameters in Tableau online and Server. This allows for greater customisation of your parameters, allowing you to reflect some accuracy of Tableau desktop:

This feature is available in Tableau Server and Tableau Online.
Use multiple data sources for map layers
Map layers is a fantastic new feature which was added in 2020.4, it allows you to add multiple layers of geographical data on a single map. With 2021.4, you can now expand the use across multiple data sources / connections.
E.g. Adding salary information per state for the US to the total donations per state:

This feature is available in Tableau Desktop, Tableau Server and Tableau Online.
All the best with exploring and implementing these features!-
Empower your organization with intuitive analytics
Tableau is designed to put the user first because data analysis should be about asking questions and not about learning software. With built-in visual best practices, Tableau enables limitless visual data exploration without interrupting the flow of analysis.
As the market-leading choice for modern business intelligence, the Tableau platform is known for taking any kind of data from almost any system and turning it into actionable insights with speed and ease. It’s as simple as dragging and dropping.
We are a full-stack provider and integrator, relying on extensive experience and best practices to find your unique optimal set-up allowing you to tell the data stories you are eager to tell.