Row level security with Google Sheets & Tableau Prep
I recently worked on a project where we used SAP HANA. When asked about how to make sure users would only see the data they are allowed to, I introduced the client to row-level security (RLS).
The basis to successfully implement RLS is to have a list of all the users with a dimension to build governance on, which is something that my client didn’t had available in their SAP database. It was clear that this list had to be created and uploaded into SAP, so I suggested bypassing SAP and using Google Sheets for three main reasons.
-
Tableau is perfectly capable to do cross-database joins
-
The maintenance would be easier
-
To prove it is possible
This decision was purely made out of necessity to show that it can work and we will work toward a more robust and scalable alternative.
A side-effect will be a duplication of data. Row-level security can be implemented in several ways, this solution will lead to duplication of rows. If you already have issues with data volume, this might not be viable for you.
We have used Tableau Prep, Tableau Desktop and Google Sheet to achieve it.
Refresher: what is Row-Level Security?
Row-level security is a concept that will apply a type of filter that allows users to see only the data rows they are allowed to view. It’s not proprietary to Tableau and is a general concept that can be used when working with data.
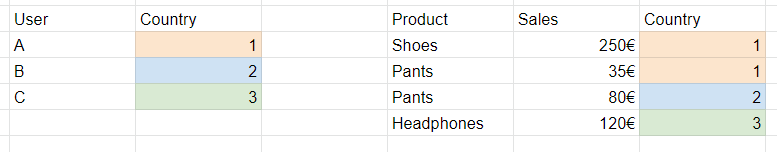
In this case above, each user should see only the data for the country he is assigned to.
In Tableau Row-Level security can be implemented in various ways and for this article we will end up shaping our data source to have the following structure:
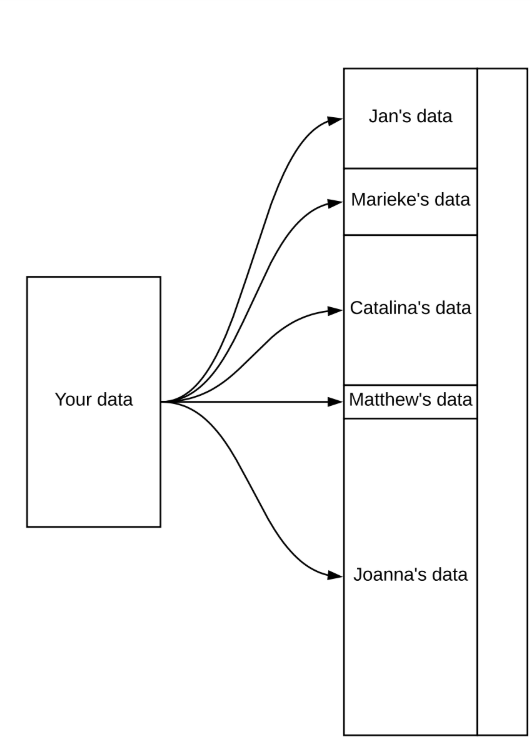
One con against this method is we will have a duplication if a data row is assigned to multiple users. Pro to this approach is that the filter we will apply to apply our security is very efficient (Boolean Filter).
So for each query Tableau Server will check what rows a specific user is allowed to see, meaning first we need a list of users with their username.
Building the Data source
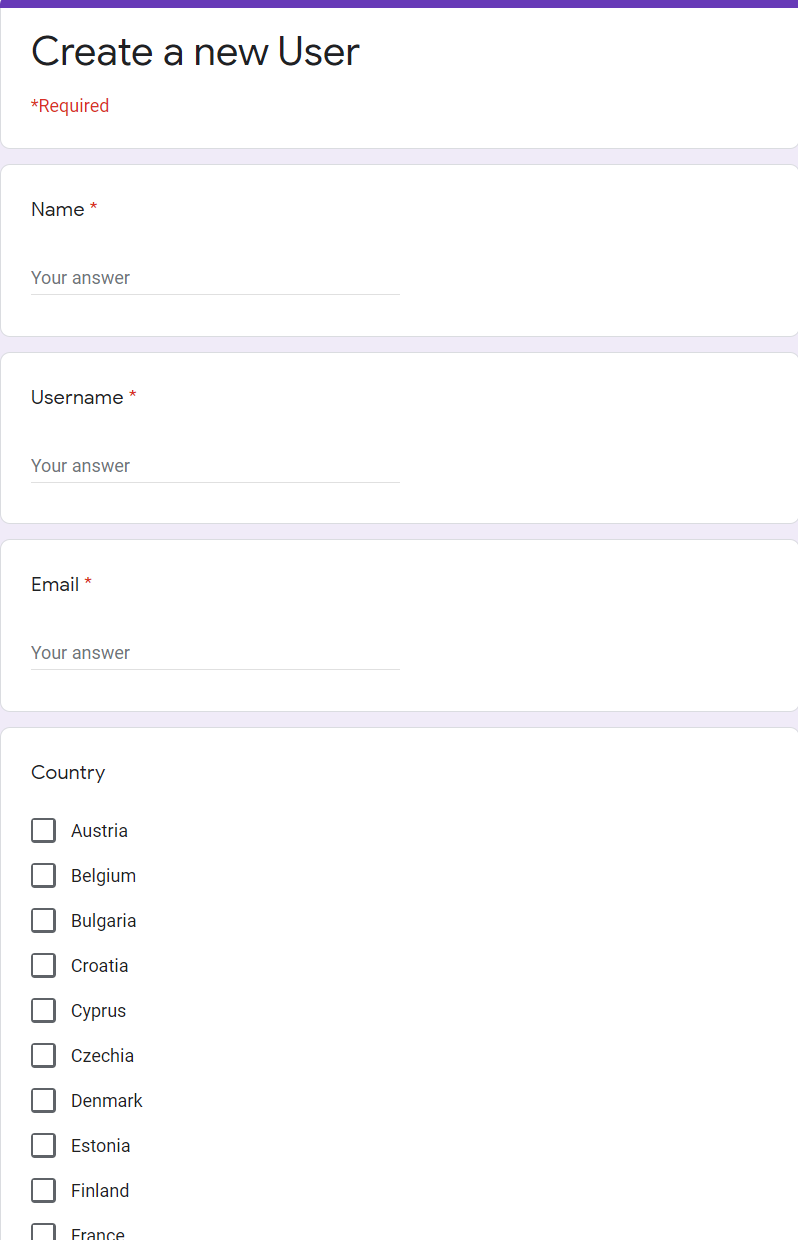
We’re going to use Google Forms to create a new user. Why Google Forms? It’s a consistent way of adding new users. Now this will come with a bit of work but once set up, this solution requires little maintenance.
For this example I’ve opted for 5 questions to be filled in:
-
Name - Short Answer (Optional)
-
Email - Short Answer (Optional)
-
Username - Short Answer (Required)
-
Country - Checkboxes (Required)
Name & Email are just to facilitate later maintenance. If you have to edit a user's permissions, you can simply add a filter on the Name or Email column to search.
Username & Country are the dimensions we will use to build our security.
Username is the Username assigned to a person on the Tableau Server.
Country is the dimension that we will use to validate which rows a user is eligible to see in our data source.
Both - Username and Country - are case sensitive!
So if you have 80 countries, you will need to select them all in your list. Small tip: you can actually copy-paste all your values in the checkboxes edit menu, a real time saver!
ETL work
Let’s have a look at the Google Forms output. If you go to the Google Forms, on the top you can select Responses and click on the Google Sheet symbol.
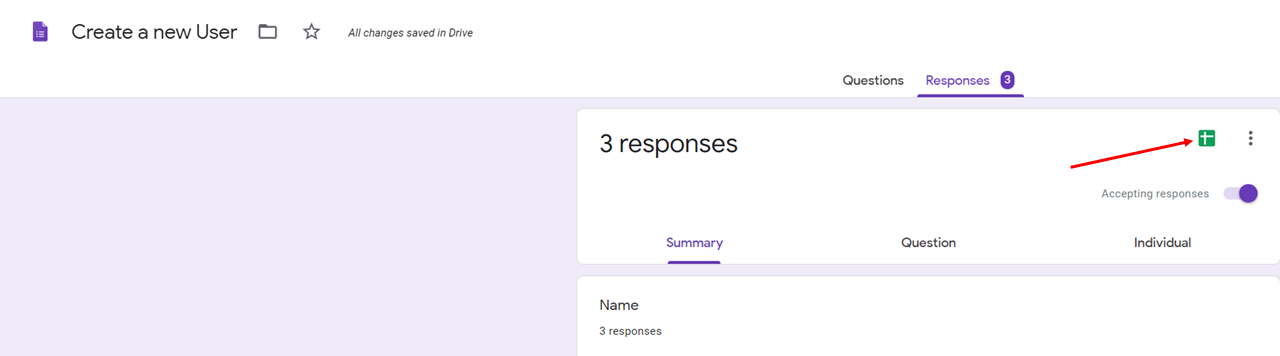
Now you will be able to see the results in Google Sheets.

Google form is creating a concatenation of all the results. If a user has access to several countries the value in the Country column will look like the following:
Austria, Belgium, Bulgaria, Croatia, Cyprus, Czechia, Denmark, Estonia, Finland, France, Germany, Greece, Hungary, Ireland, Italy, Latvia, Lithuania, Luxembourg, Malta, Netherlands, Poland, Portugal, Romania, Slovakia, Slovenia, Spain, Sweden
The end result we are looking for is a list of countries with a row for each user.
At this point we have created our data source. Now we need to shape this data and join it to our Sales Data. For this step we are going to use Tableau Prep. The ETL Tool provided with any Tableau Desktop Creator license.
To be able to create a flow to cover every country, it is important to create the first users and assign them to every country. Otherwise the missing countries will not be part of the pivot!
We will create a “SuperAdmin” user, someone that can access every country.
The final Tableau Prep Flow looks like this:
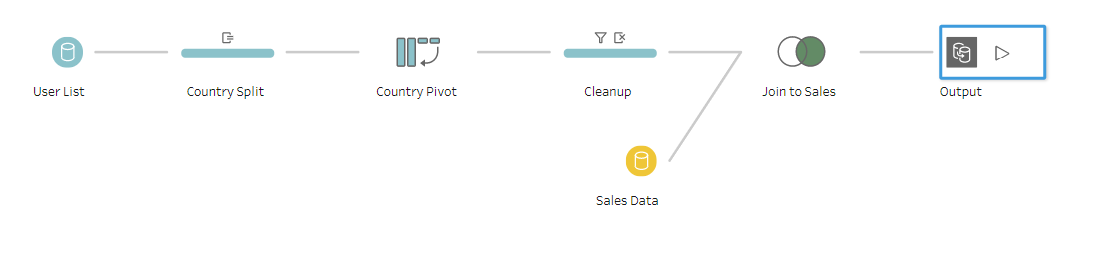
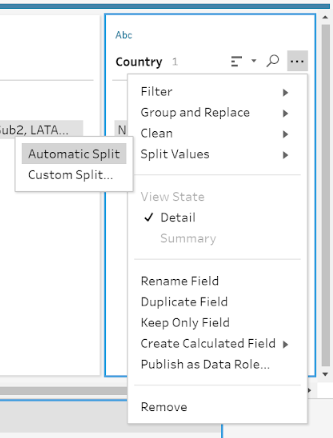
Country SpLit
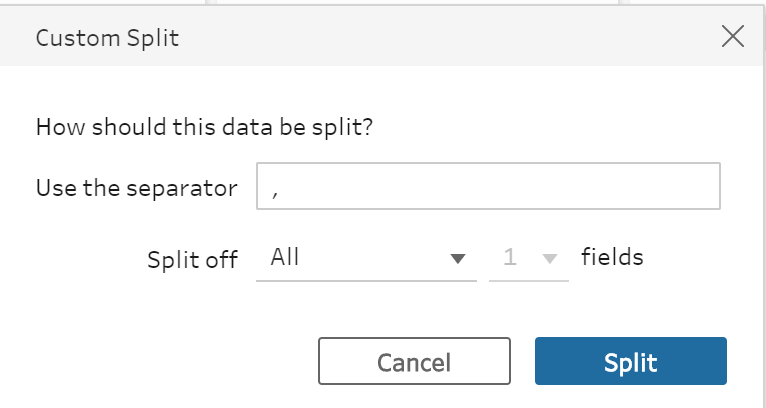
Create a split on the Country dimension. Separator is , and Split off is All.
Pivot
Select all the country Splits and pivot them.
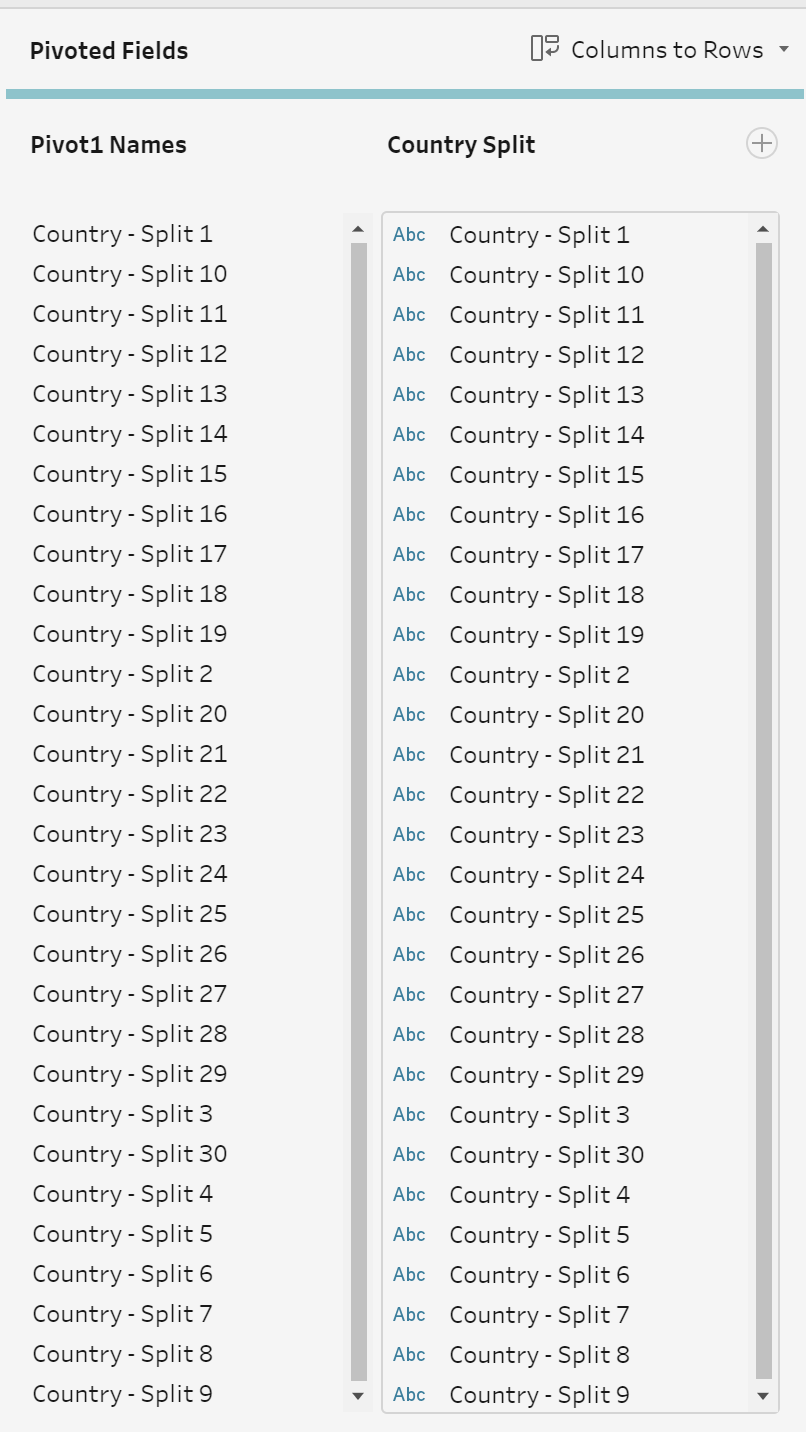
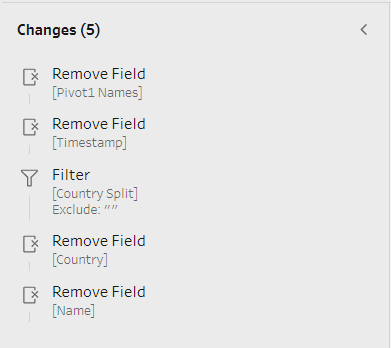
Cleanup
We’re going to remove all the unnecessary fields and filter out unwanted values.
Remove:
-
Pivot1 Names
-
Timestamp
-
Country
-
Name
Filter:
- Country Split: Exclude “”
Let’s have a look at the end result.
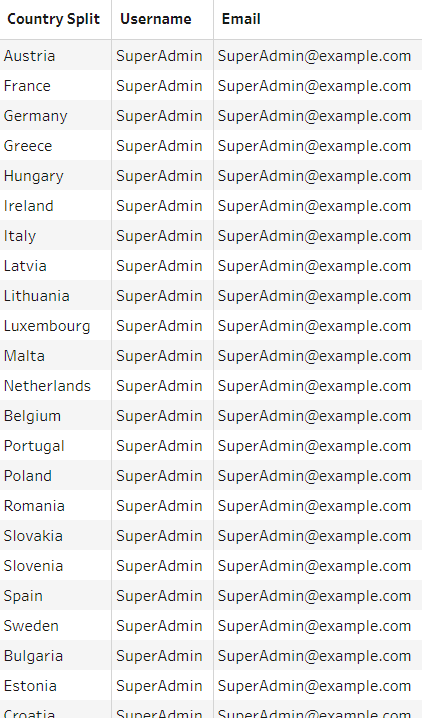
We can see that the user superadmin is now listed in each country he has been assigned to.
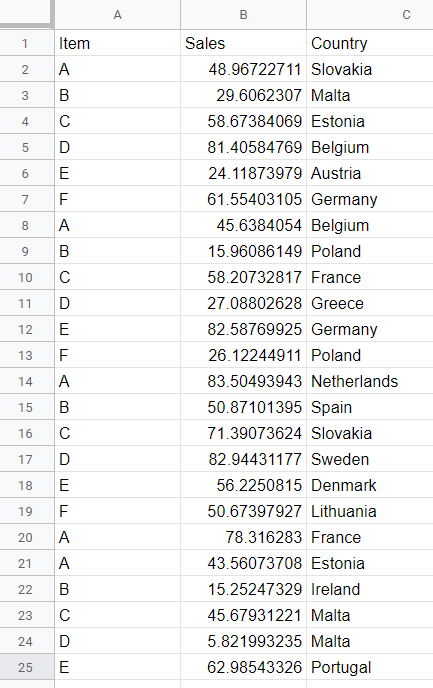
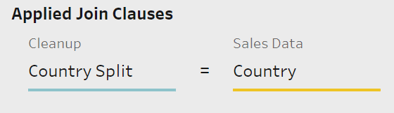
The last step is to join it to our sales data using the country dimension.
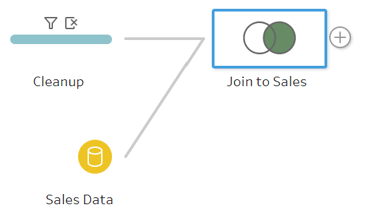
Final flow step is to add an output.
You can now publish this flow to your server and schedule it according to your need.
Apply RLS
Let’s have a look at the data source we have created.
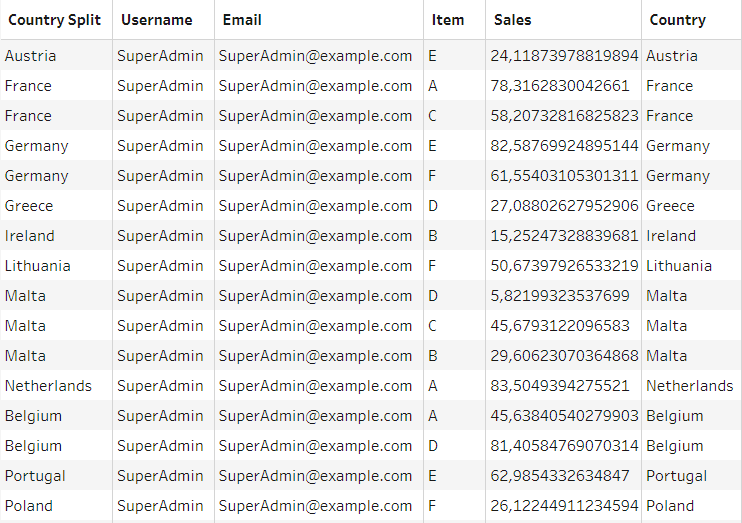
We can see that we have added a new Username column. This is the column we will use in Tableau Desktop. We’ll apply our RLS on a workbook level.
Create a calculated field with the following calculation.
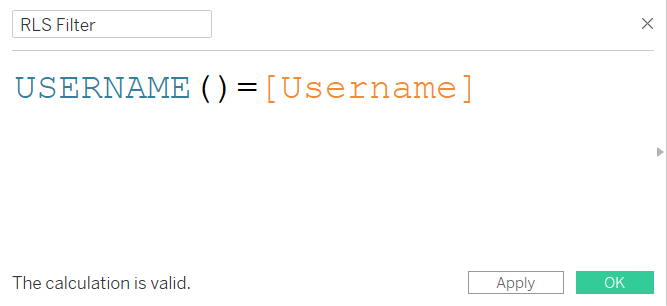
You can now either apply it as a data source filter, especially important if your users are allowed to use Web Edit. Has a data source filter they will not see it and will not be able to remove it.
If applied on the worksheet level, make sure it's applied on every worksheet used on your dashboard.
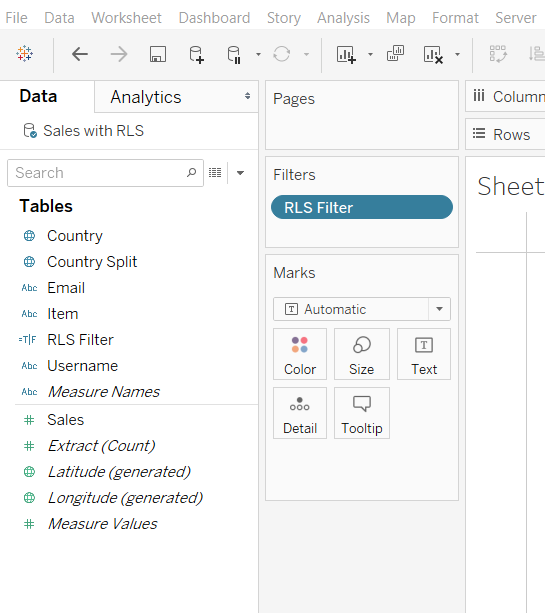
Applied on the worksheet
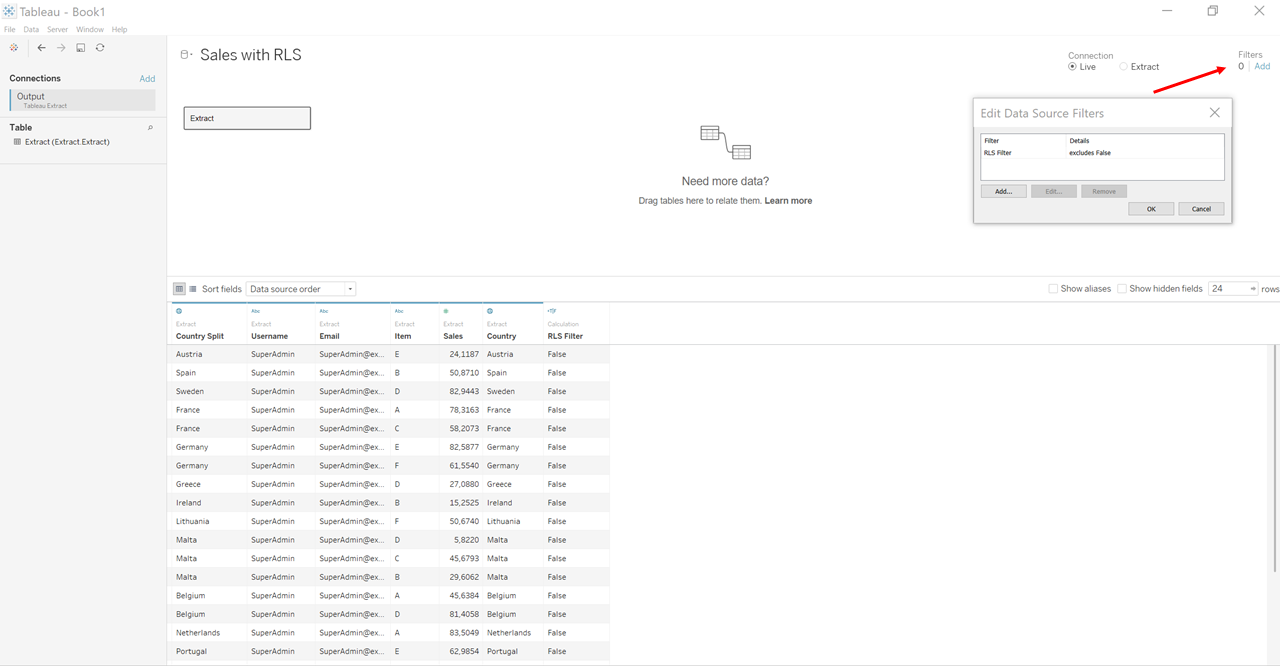
In the data source pane, in the top right corner select Filters and apply your RLS filter.
In both cases apply “True” to the filter value.
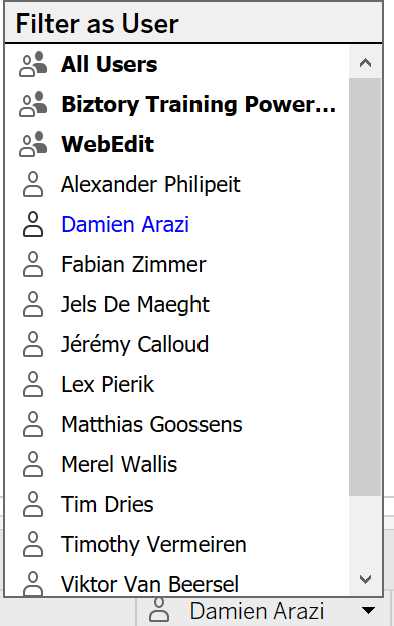
You can test it by impersonating a user on the bottom right.
Conclusion
Row-level security can work with Google Sheet! Remember that one of the main goals was to display the possibility to implement row-level security with Google Sheet and it does!
With this approach, we have created a new data source which is low maintenance and fulfils the governance purpose. With simple Google Forms as an input, Tableau Prep to shape our data and a Google Sheet as our data source.
Feel free to reach out if you want to learn more about Row-level security. This is just one of the many different ways you can implement your user governance.
- Damien
Empower your organization with intuitive analytics
Tableau is designed to put the user first because data analysis should be about asking questions and not about learning software. With built-in visual best practices, Tableau enables limitless visual data exploration without interrupting the flow of analysis.
As the market-leading choice for modern business intelligence, the Tableau platform is known for taking any kind of data from almost any system and turning it into actionable insights with speed and ease. It’s as simple as dragging and dropping.
We are a full-stack provider and integrator, relying on extensive experience and best practices to find your unique optimal set-up allowing you to tell the data stories you are eager to tell.