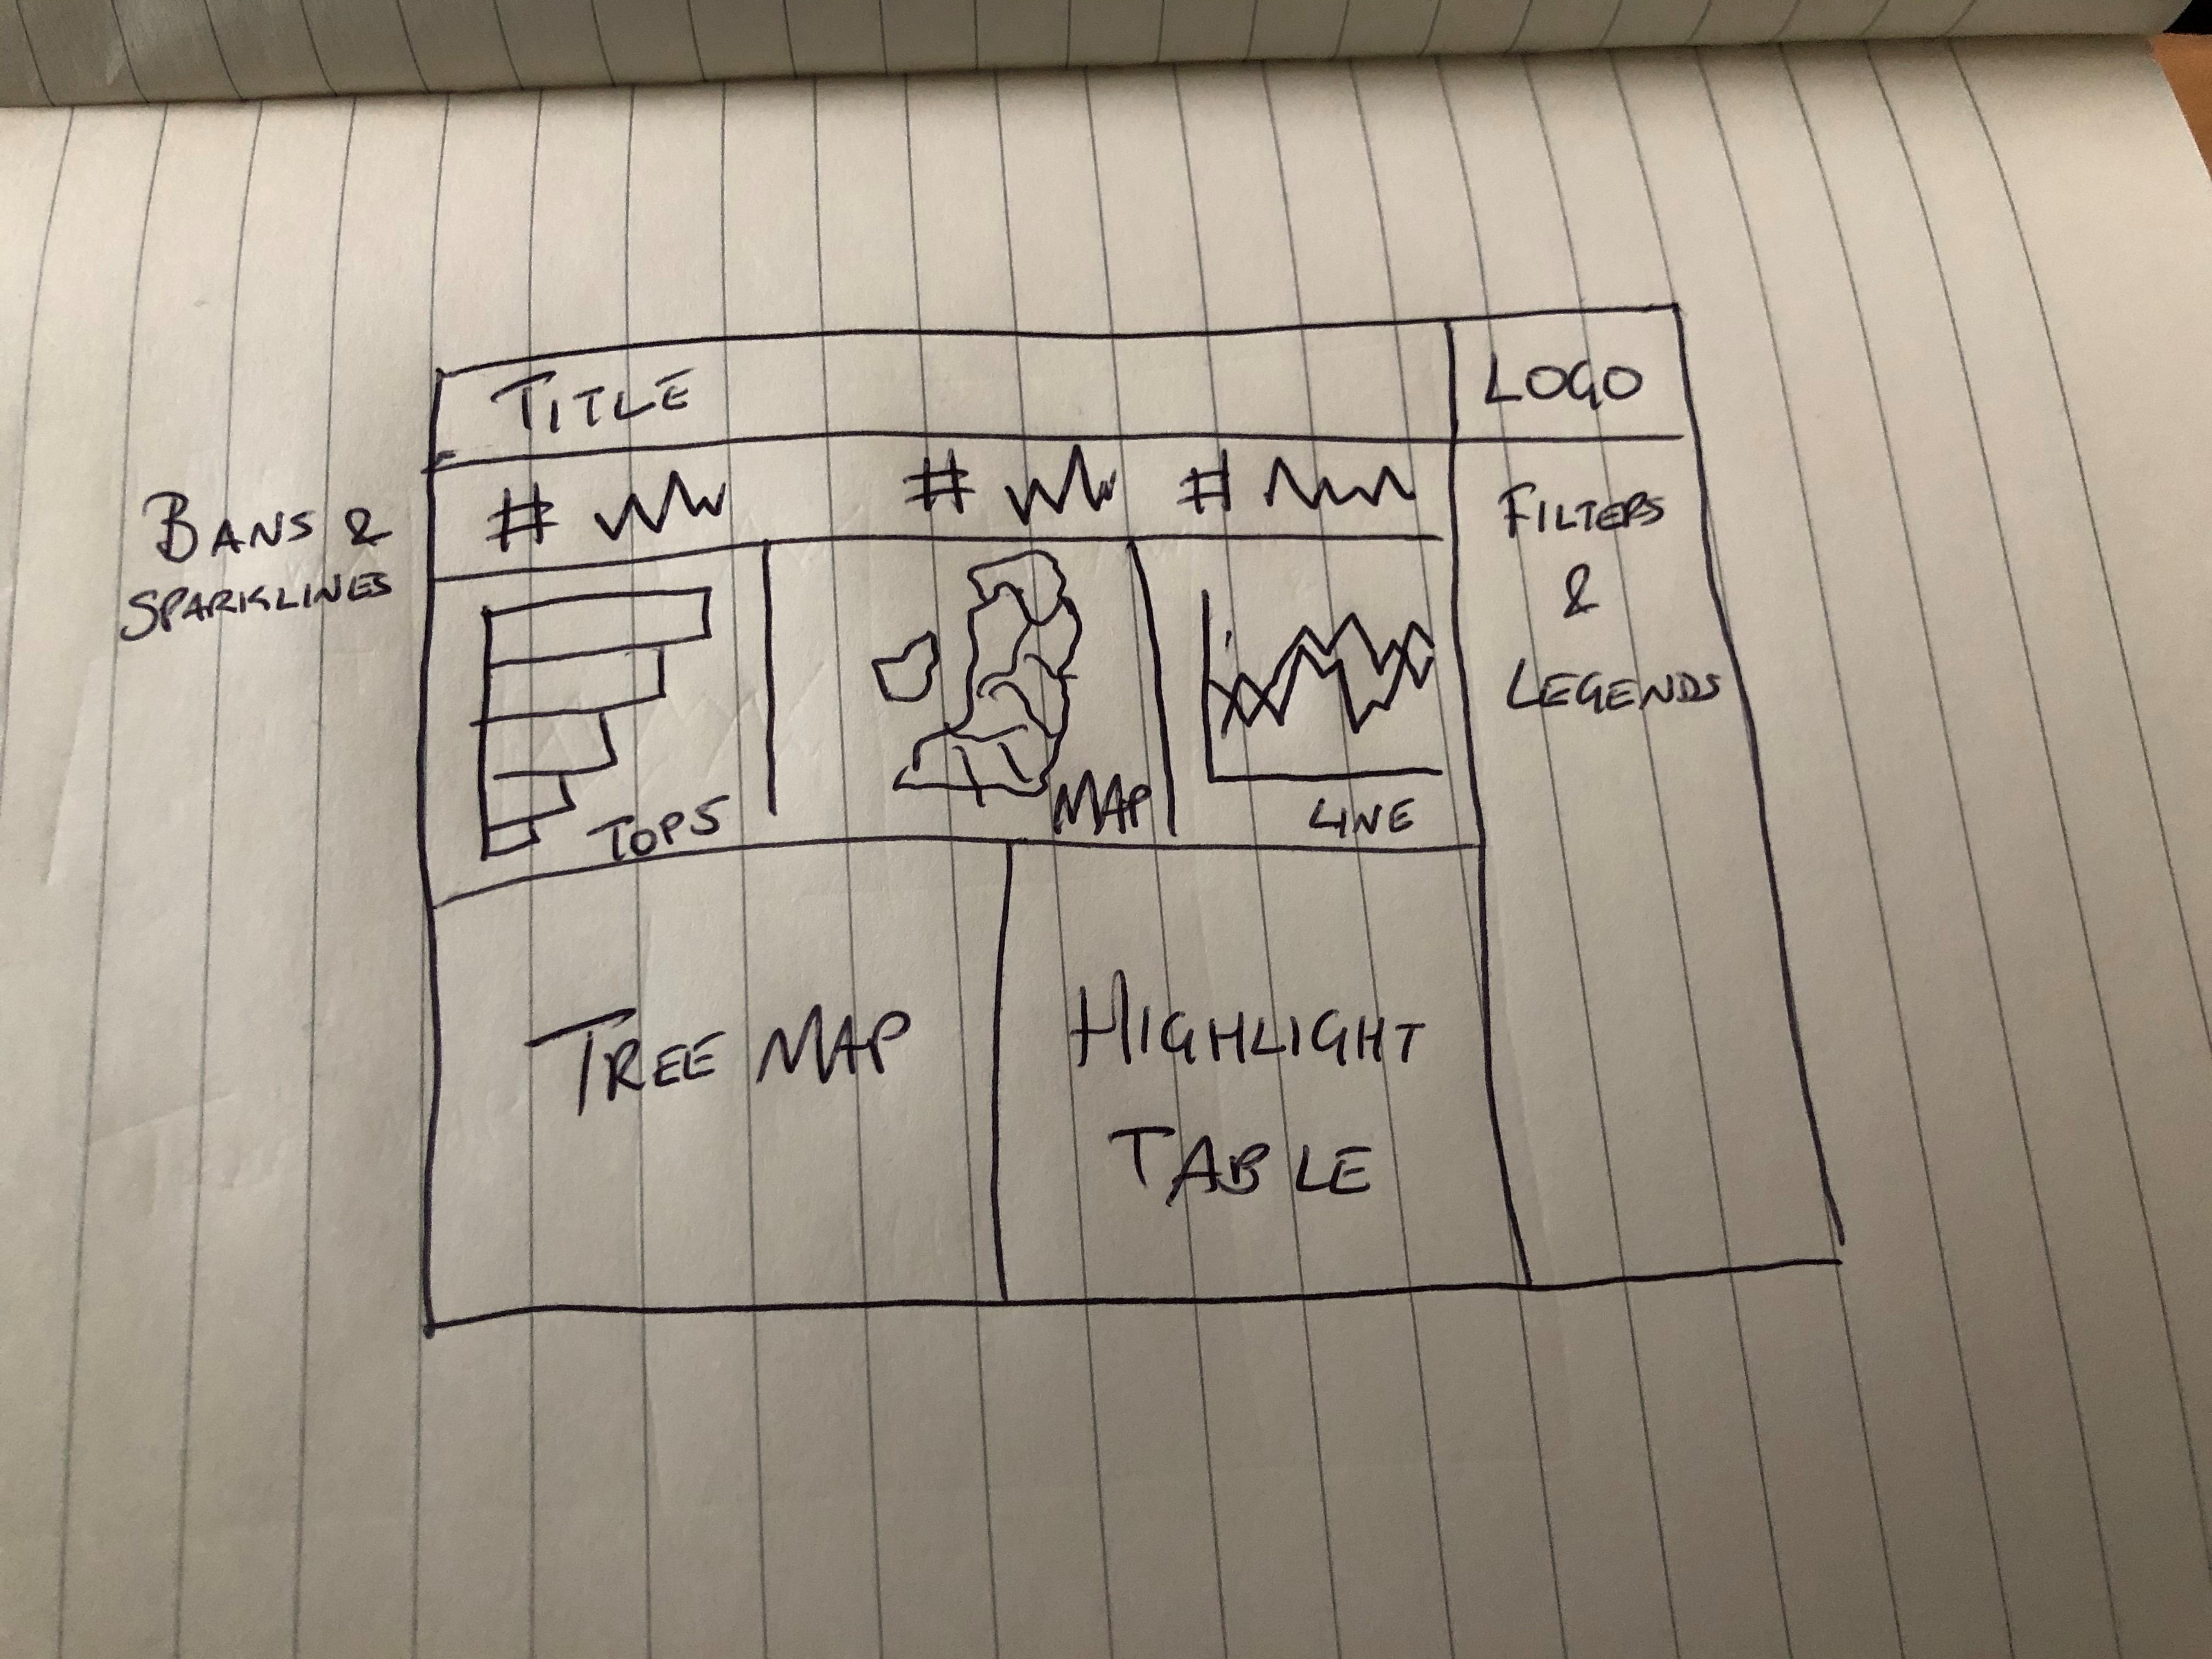
Combining the Relationship model with Data scaffolding. A visualization technique that uses a simple structure that will support your data for analysis
The following is a basic guide on using a part of the set action dialog box with visual examples of what each selection results in.
Learn how to make Layout Containers in Tableau work for you EVERY SINGLE TIME in your Tableau Dashboard.
What's the most convenient route to visit certain capitals? Let's use Parameter Actions and Geographical Functions to find it out!
Tableau first released step and jump lines back in 2018.1. Let’s jump back in time and see why this release was a step in the direction of making our data lie a bit less.
Lately, Tableau added some new functionalities called 'Spatial Functions' by which you can really improve your mapping analyses. Read more here.
This short paper provides an introduction to working with & analysing football data. It focuses on using StatsBomb event & match data to analyse and present direct set pieces.
Recently, one of our colleagues reported a very interesting “feature” around filters in Tableau. Read our latest blog to learn more about the 'please select' filter.
Part 3 of the Tableau training programme is Tableau Desktop III: Advanced. Read our latest blog to learn how you can master this training.
Learn about how to add the personal touch to your Tableau Dashboard with custom titles.
Tableau Parameter Actions are a great feature in Tableau. Read all about it in our latest blog.
Take control charts to the next level in Tableau. In this blog we will talk about a calculated set of control limits to highlight outliers.