Having troubles when you integrate Tableau and R? Here are some tips and tricks for intermediate users! Read all about it!
Standalone Data is dead. With Tableau data is more integrated than ever, and we couldn't be more exited.
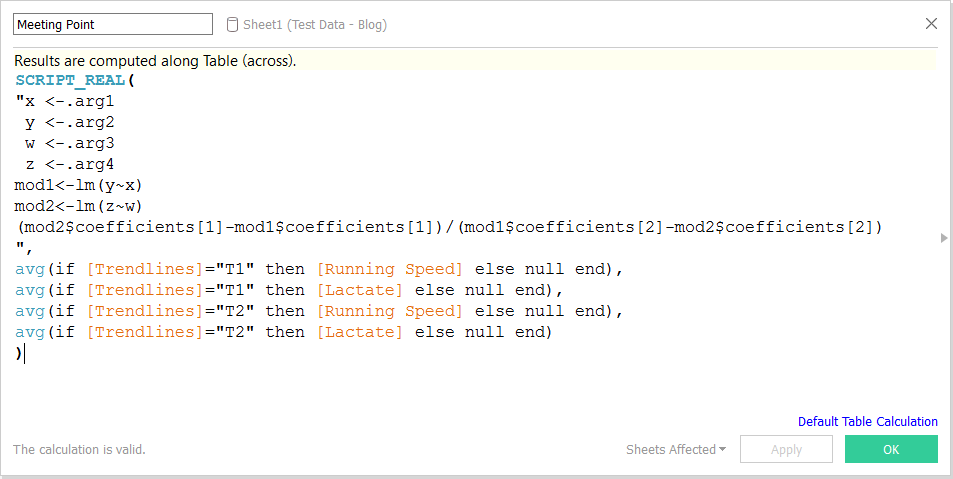
Want to integrate Tableau and R? Here are some tips and tricks for intermediate users! Read all about it!
Tableau’s Order Of Operations Or What Happens When And How
Do you want the slides of the Data Analytics conference: Guided vs Self-Service? You can find them here.
A quick view into how you can calculate slope and intercept with Tableau or Tableau integrated with R and the use cases of these KPIs.
The story behind the creation of an awesome Chicago Tax Viz, with Tableau and Exasol on 105M records. Part of the Makeover Monday series.
In this blog we discover how to plot streets in Tableau using Alteryx.
In this blog we explain how to make Tableau dashboards look great on all the screen sizes.
Create different viewpoints in Tableau by using parameters to filter your filters. This makes sure different kind of users can use the same dashboards!
Useless (but fun) Tableau Tricks: "Rendering" Images in Tableau
In this post we explain how to create a Whale chart in Tableau to discover best/worst profitable customers.