Time for another Iron Viz post! Timothy from Biztory explains how he made his Iron viz.
This is a short post with a useful recommendation regarding performance when working with parameters and extracts in Tableau.
Versatile Tableau: Can you use Tableau to create your bank statements? Read this blog post and find out how you can create your bank statement.
Timothy from Biztory took part in the #IronViz Europe and chose to analyze the data of the Eurovision Song Contest.
In Tableau's most recent Iron Viz cycle (March 2017), the focus was laid on a new capability of Tableau 10.2: the ability to connect to shapefiles.
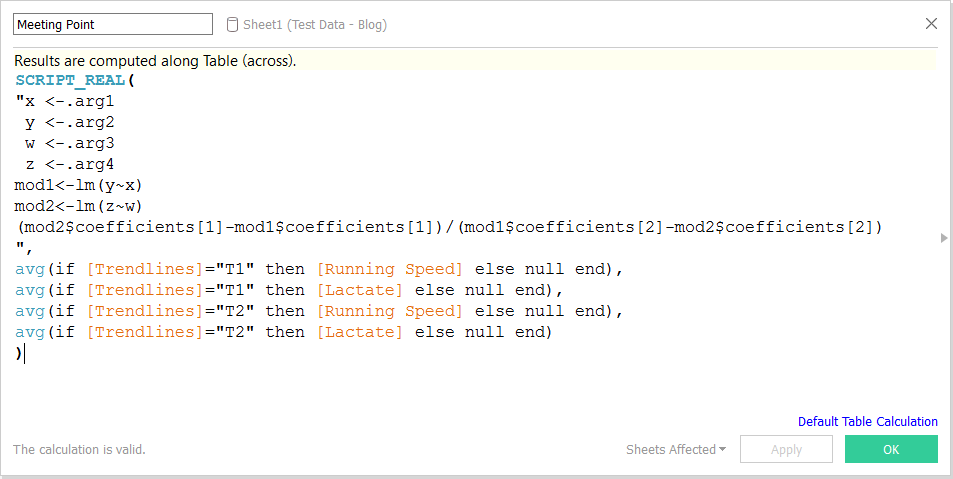
A quick view into how you can calculate slope and intercept with Tableau or Tableau integrated with R and the use cases of these KPIs.
A blog about the versatility of Tableau. Is it possible to use it not only as the best visual analytics tool but also for invoicing?
Taking the Tableau Desktop Qualified Associate exam soon? Read about my experience and follow these steps and start your exam fully prepared!
The story behind the creation of an awesome Chicago Tax Viz, with Tableau and Exasol on 105M records. Part of the Makeover Monday series.
A clever trick with custom color palettes to assign values to data in Tableau Desktop.
In this blog we discover how to plot streets in Tableau using Alteryx.
In this blog we explain how to make Tableau dashboards look great on all the screen sizes.