Learn how to label bar charts in Tableau like a pro and level up your dashboard design. Read the full article here.
What is Tableau Prep? Learn how to use Tableau Prep to schedule, monitor and clean your data for analysis. Read the full blog here.
Learn how to connect your Tableau Cloud data with the Salesforce CRM Analytics input connector in our latest blog.
A few simple tricks for how to call out elements of your data
Well if you're more experienced with Salesforce and know less about Tableau, this article is one you shouldn't miss. Let's find out in 3 reasons why...
Learn how to use Hyper API to automate a complex data workflow in Python straight to a published datasource on Tableau Server. Read the full blog here.
With the arrival of the write to CRM Analytics from Tableau Prep feature, Salesforce is pushing the integration with Tableau even further. Read more here.
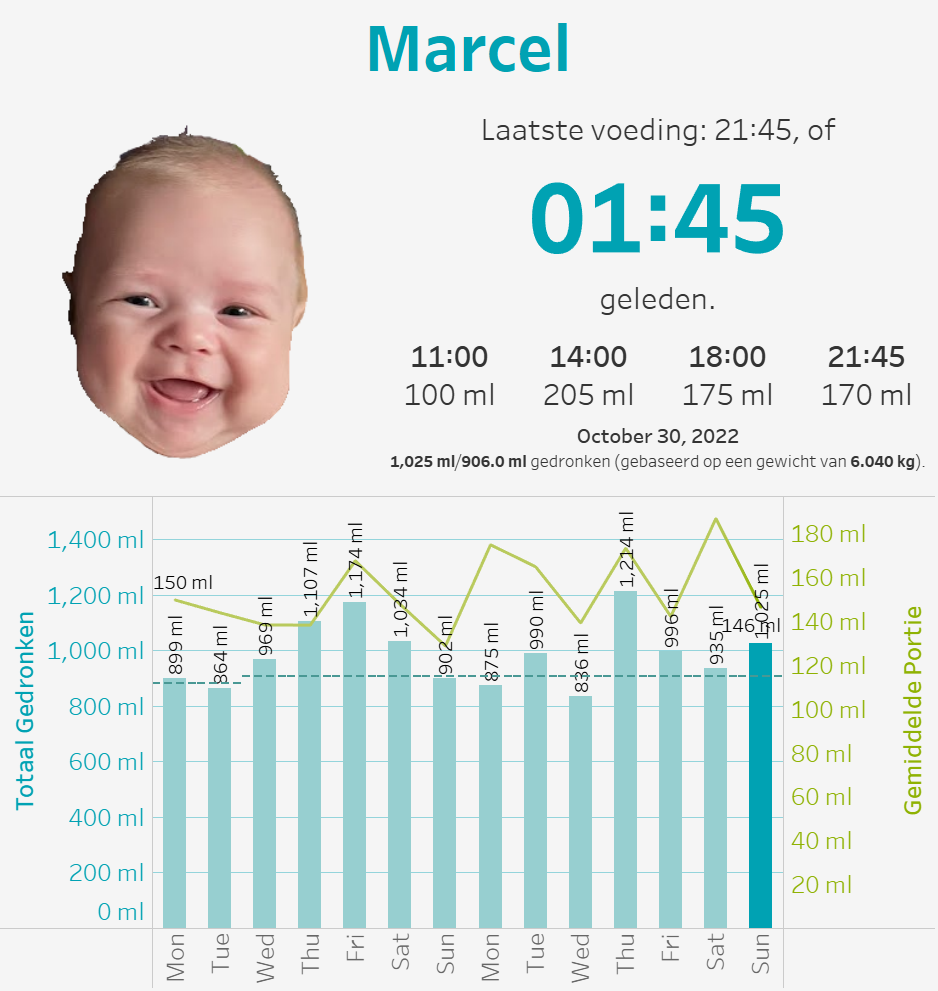
A different take on an alternative dashboarding and data viz project, that may inspire you to do something unique in the future!
Biztory and Spire Group join forces to integrate Tableau's data analytics strengths with the power of Salesforce. Read the full press release here.
Follow this tutorial and learn how to create an interactive calendar in Tableau Desktop. Read more here.
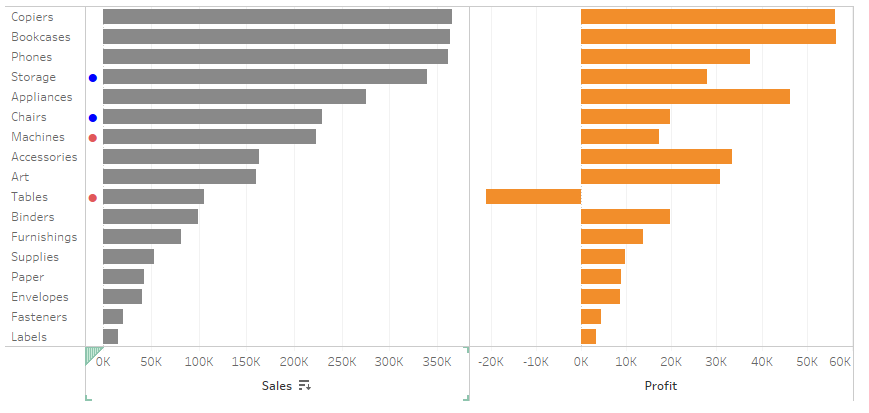
Learn how to identify the top N and compare it against all others across multiple categories in Tableau. Read all about it in our latest blog here.
Tableau project leader is a useful role in Tableau server to assign users with administrator-like access for a specific project. Read more about it here.