Callouts draw your users’ gaze to a specific area of a data visualization. Read more on how to use them to make important areas of your data stand out here.
3500 data professionals, including our Tableau Visionaries , Sam & Donna, recently gathered for the #Data22 Conference. Read about their highlights here.
Tableau conference #data22 sessions and content guide written by visionaries Donna Coles and Sam parsons
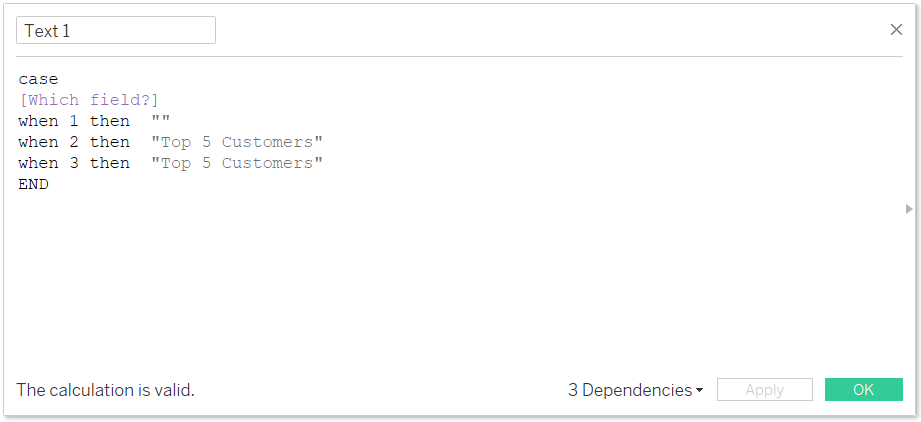
Exclude and keep only values in Tableau when you have tooltips off
Let's discover how you can make your dashboard more interactive with a couple of tricks!
The 2022 Tableau Visionaries — a new title replacing Zen Master — are announced and we're proud to say that two Biztory colleagues have the honour!
Ever wondered how you could use one date filter in Tableau to drive multiple visuals in different ways? Look no further, the answer you're looking for is parameters!
Tableau identified 5 data trends that will impact your business. Receive a peek into our top trends or dig into the entire 2022 Data Trends report.
Discover how you can hide outliers from your visualisation (or focus on them) to improve the readability of your visualisations in Tableau.
Biztory's Analytics Consultant Armani Eloise guides us through all the exciting new features of Tableau 2021.4. Happy reading!
Here are five personal recommendations from me that can help you visually enhance your graphs and get you started on your visual analytics journey.
[Latest updates] Our technology partners are working on updates and actions related to the recently uncovered vulnerability designated as CVE-2021-44228.