Take control charts to the next level in Tableau. In this blog we will talk about a calculated set of control limits to highlight outliers.
Create advanced control charts & P-control charts in Tableau.
With control charts one can see if something is normal behaviour or not. We dive into these control chart using Tableau.
Tableau 2019.3, Server Management add-on, Explain Data, Tableau Catalog from 1. Iron Viz winner Timothy Vermeiren, 2. the community and 3. myself.
In this blog about control charts in Tableau, we make a control chart for Six Sigma Western Electric and put our knowledge in real life.
Tableau can connect to R, Python and Matlab. In this blog we discuss the numerous resources and examples on this topic.
Get to know your fellow Tableau Public authors with Behind the Viz. In this blog we get to know James Smith.
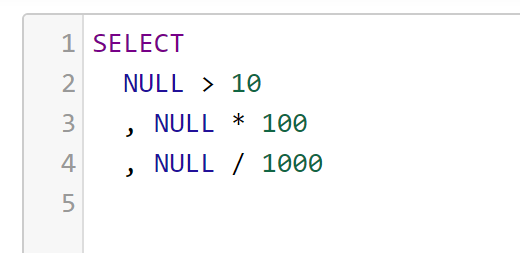
Having troubles with NULL values in your data? How do you fix this NULL values? Here are 7 things you should know about them.
Having troubles when you integrate Tableau and R? Here are some tips and tricks for intermediate users! Read all about it!
Alexander from Biztory explains how he makes art with bar charts in Tableau.
Tableau Conference Europe 2018 starts tomorrow! The whole Biztory team is attending conference and we couldn't be more excited.
Standalone Data is dead. With Tableau data is more integrated than ever, and we couldn't be more exited.


.png)