How can I take my Tableau skills beyond the formal Tableau Desktop training? Learn about Visual Analytics best practices and other great ways to learn.
Part 3 of the Tableau training programme is Tableau Desktop III: Advanced. Read our latest blog to learn how you can master this training.
Part 2 of the Tableau Desktop training programme is Tableau Desktop II: Intermediate. Learn all about it in our latest blog post. Read more here.
The first step in your journey of Tableau Training, Tableau Desktop I: Fundamentals explained
Tableau is fast becoming a must-have skill when applying for analyst roles. Interested to learn how you can master this skill? Read this blog here.
Learn about how to add the personal touch to your Tableau Dashboard with custom titles.
Thinking of taking one of the Tableau Certifications? We explore the benefits in our latest blog pots. Read all about it here.
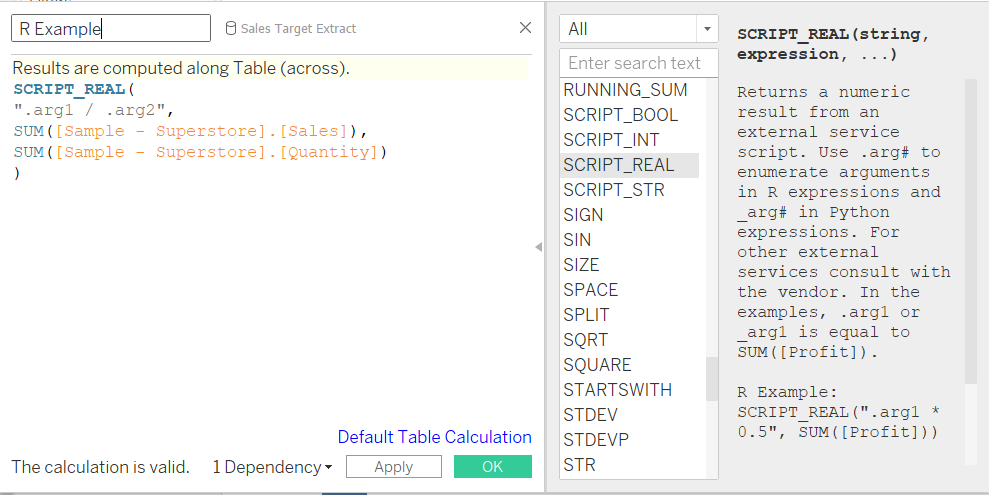
A step-by-step guide to connecting Tableau Desktop to R using Rserve.
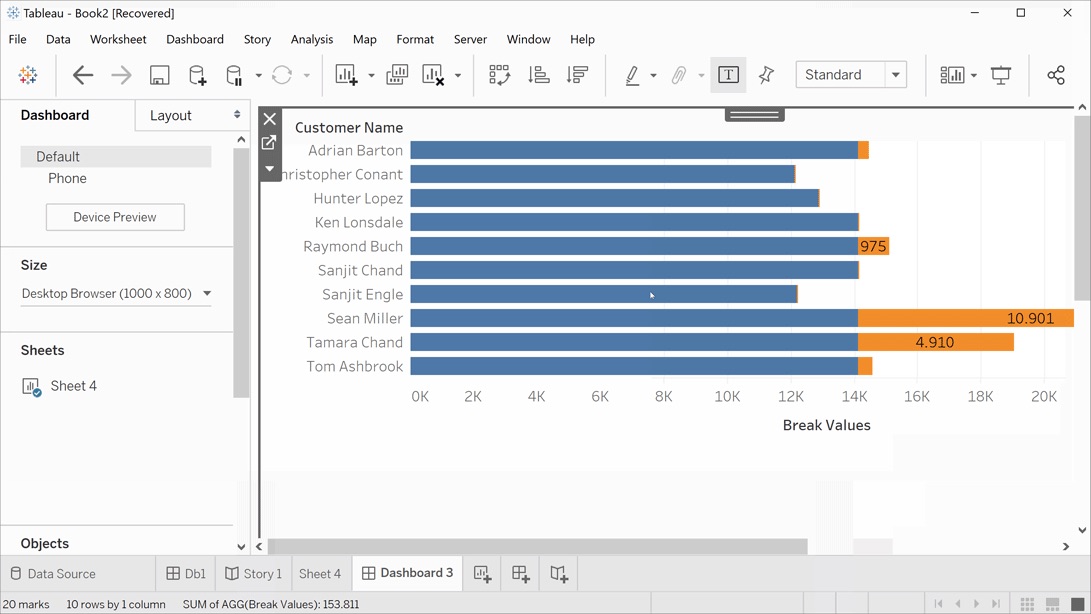
Tableau Parameter Actions are a great feature in Tableau. Read all about it in our latest blog.
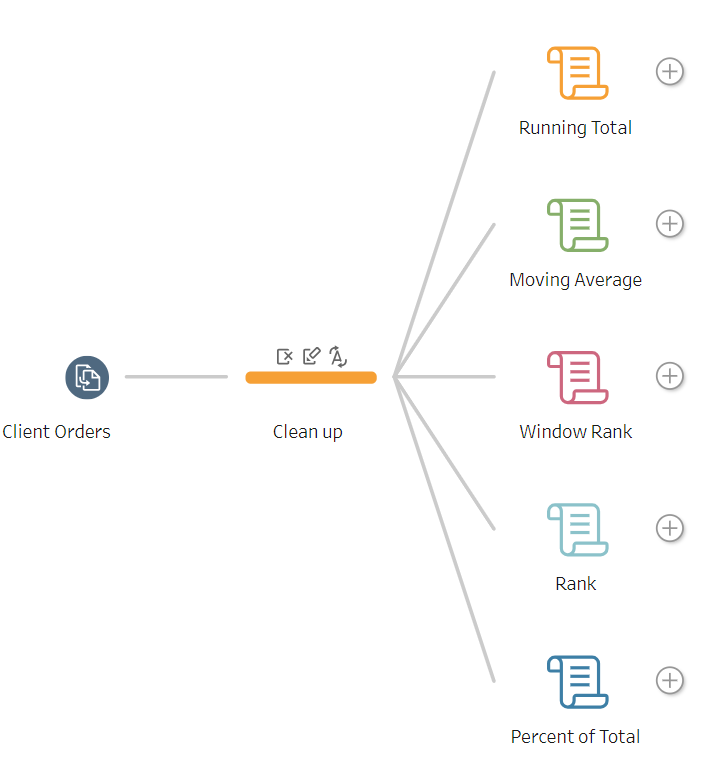
Read our latest blog to learn more on how to make your own table calculations with Python in Tableau Prep Builder. Learn more here.
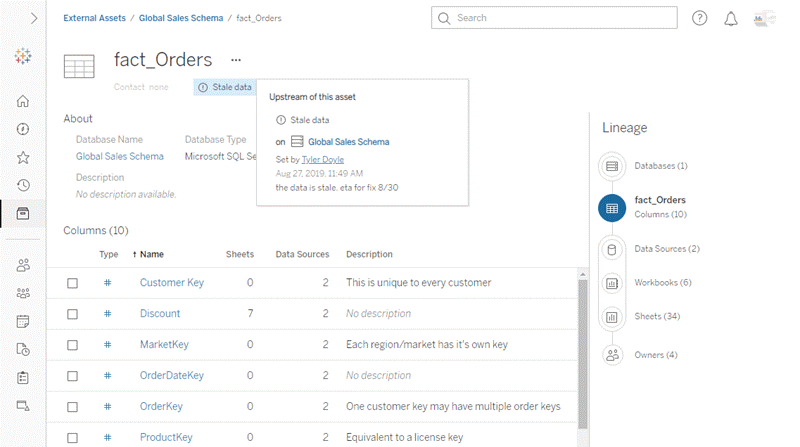
Tableau 2019.3, Server Management add-on, Explain Data, Tableau Catalog from 1. Iron Viz winner Timothy Vermeiren, 2. the community and 3. myself.